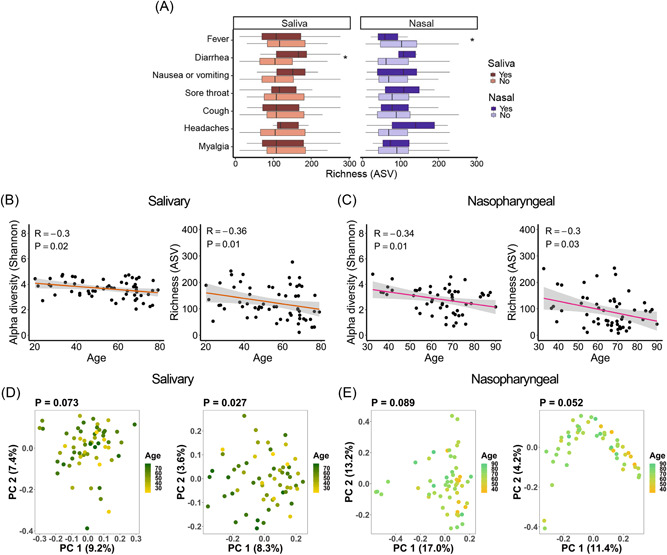
Figure 3.

Associations between salivary and nasopharyngeal microbiomes of severe acute respiratory syndrome coronavirus 2‐positive patients and coronavirus disease 2019 symptoms and age. (A) Alpha diversity, represented by richness, in saliva (red) and nasopharyngeal swab (blue) samples, for patients with a given symptom (dark red or dark blue) or without (light red or light blue). Age versus alpha diversity represented by the Shannon index and richness of salivary (B) and nasopharyngeal (C) microbial communities. Principal coordinates (PC) analysis of weighted (D, E, left) and unweighted (D, E, right) UniFrac distances for salivary (D) and nasopharyngeal (E) microbial communities with age. The shaded areas in panels (B and C) indicate the 95% confidence intervals. Statistical significance was assessed using the Mann–Whitney U test for panel (A), Spearman's rank correlation coefficient for panels (B and C), and permutational multivariate analysis of variance for panels (D and E). *p < 0.05.
