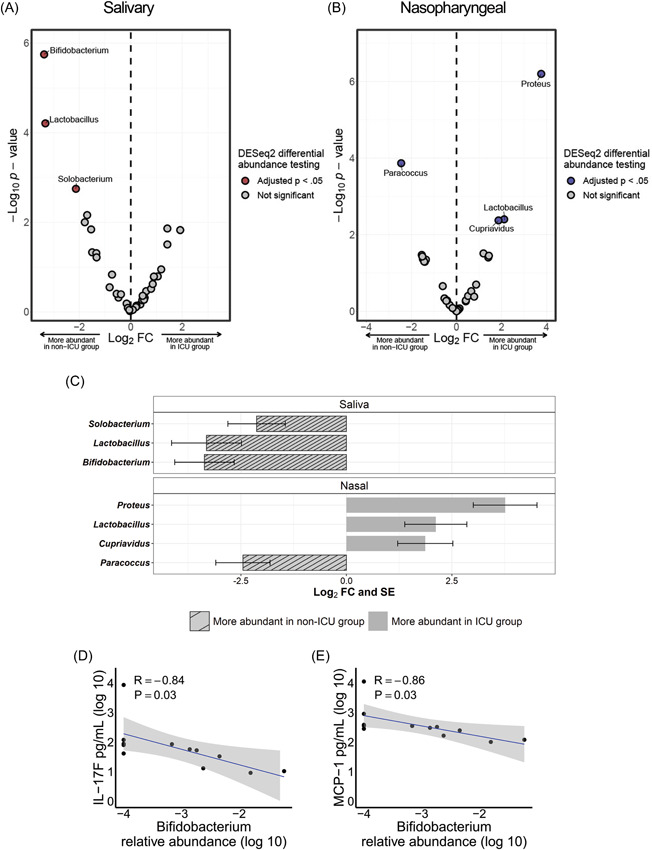
Figure 4.

Differentially abundant bacterial genera in the salivary and nasopharyngeal microbiomes between intensive care unit (ICU) and non‐ICU coronavirus disease 2019 patients. Volcano plot of log2 fold change (FC) versus ‐log10 p value for salivary (A) and nasopharyngeal (B) microbial communities. Red and blue dots represent bacterial genera whose relative abundances were significantly different between the ICU and non‐ICU groups. Significantly differentially abundant genera are summarized in panel (C). The striped bars indicate genera that were more abundant in the non‐ICU group while the solid bars indicate genera that were more abundant in the ICU group. Correlations were evaluated between salivary Bifidobacterium relative abundance (log 10) and plasma concentrations of IL‐17F (D) and MCP‐1 (E). DESeq2 p values were adjusted for multiple comparisons using the Benjamini–Hochberg method. The shaded areas in panels (D and E) indicate the 95% confidence intervals. Statistical significance was assessed in panels (D and E) using Spearman's rank correlation coefficient.
