
FIGURE 3.
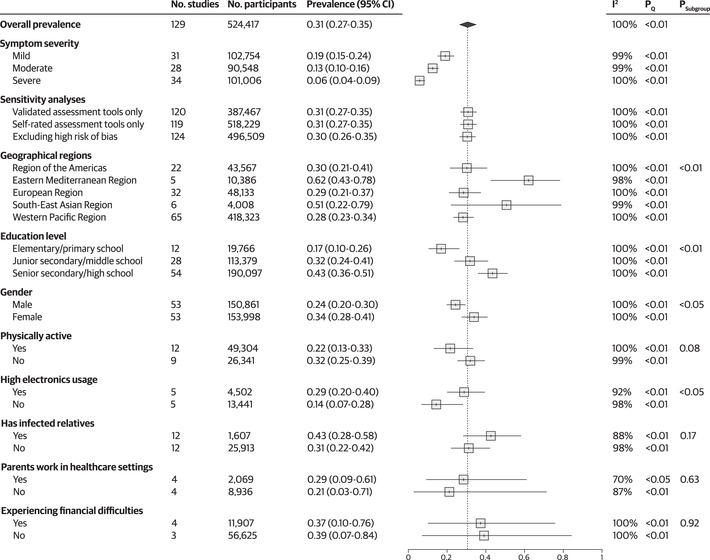
Forest plot showing the pooled prevalence of depressive symptoms and results of sensitivity analyses and subgroup analyses. Psubgroup indicates the result of the test for subgroup differences. Abbreviation: CI, confidence interval.
Official websites use .gov
A
.gov website belongs to an official
government organization in the United States.
Secure .gov websites use HTTPS
A lock (
) or https:// means you've safely
connected to the .gov website. Share sensitive
information only on official, secure websites.
Forest plot showing the pooled prevalence of depressive symptoms and results of sensitivity analyses and subgroup analyses. Psubgroup indicates the result of the test for subgroup differences. Abbreviation: CI, confidence interval.