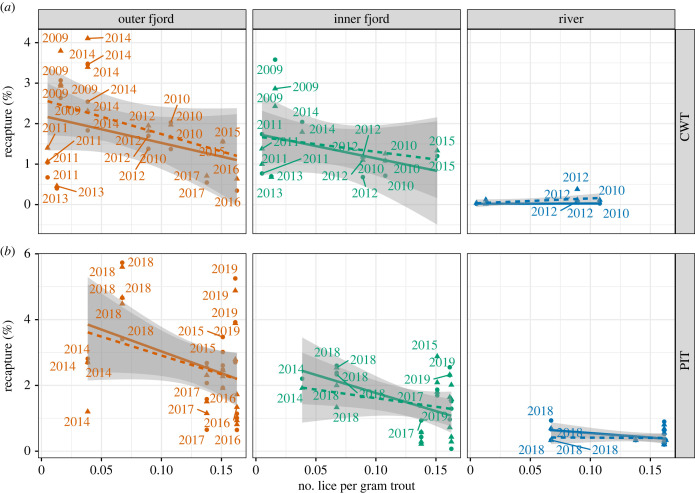
Figure 7.
Relationship between recapture and number of lice per gram of trout in treated (solid line and circular dots) and control (untreated, dashed line and triangles) groups, divided into release sites. (a) Data from fish tagged with coded wired tags (CWTs); (b) data from fish tagged with passive integrated transponders (PITs). The lines and grey envelopes show linear fit to the data with 95% confidence interval.

