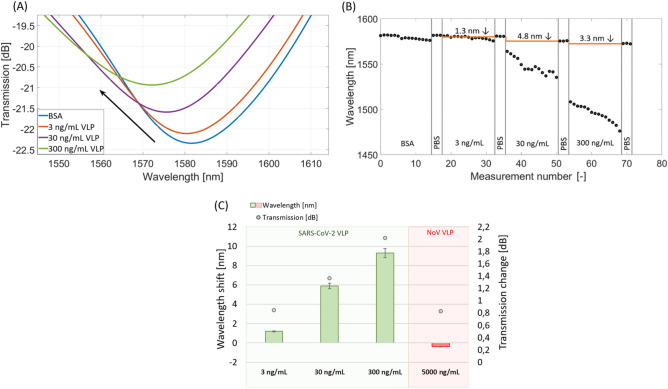
Figure 5.
The response of the µIMZI at each stage of the experiment with anti-N Abs used as a receptor and different concentrations of SARS-CoV-2 VLPs. (A) The plot shows the transmission spectra in PBS after incubation and extensive washing; (B) shows resonance wavelength at subsequent steps of SARS-CoV-2 VLP detection for the followed minimum; (C) shows a correlation between the transmission and the wavelength at subsequent steps of SARS-CoV 2 VLPs detection for the followed minimum, as well as for negative control (HNoV VLP). The baseline is indicated with the dashed blue line.

