Figure 4.
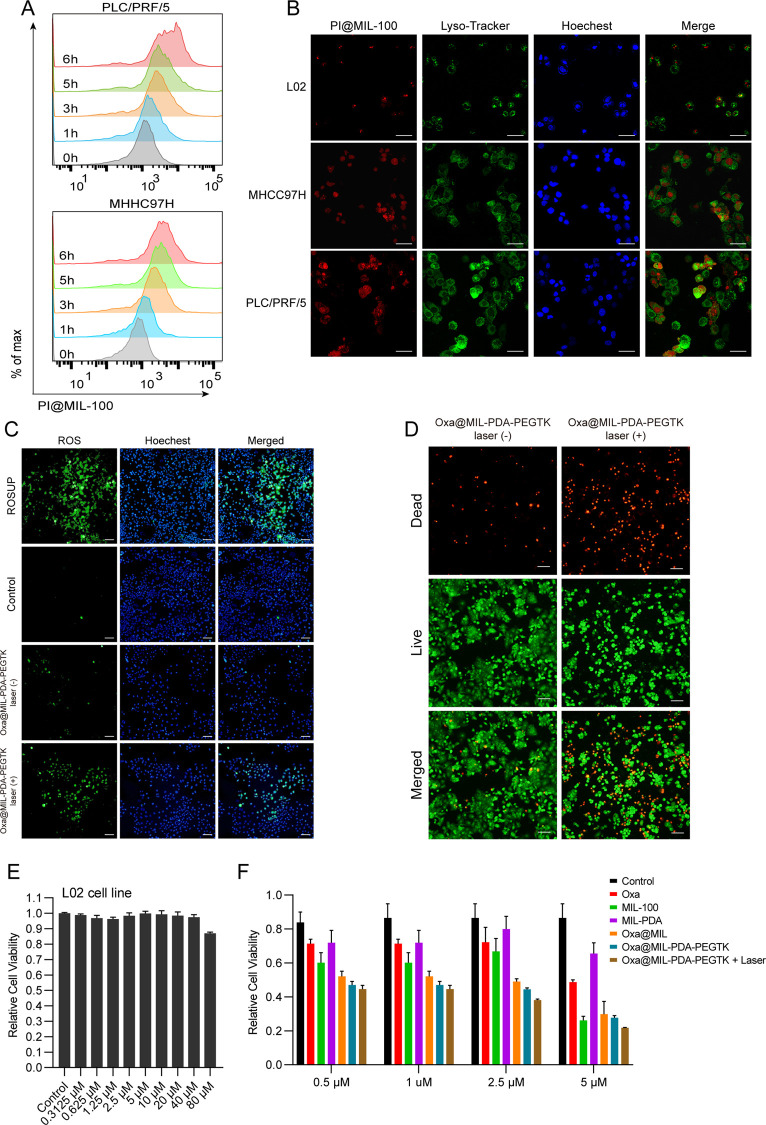
The intracellular distribution and in vitro cytotoxicity of the nanoparticles. (A) The flow cytometry analysis of PI@MIL-100 uptake by liver cancer cell lines at different time points. (B) Immunofluorescence images of normal hepatic epithelial cells and liver cancer cells treated with PI@MIL-100 for 4 h (scale bar is 100 μm). (C) Detection of ROS levels of PLC/PRF/5 cells treated with Oxa@MIL-PDA-PEGTK with or without 808 nm laser irradiation (scale bar is 100 μm). (D) PLC/PRF/5 cells were treated with Oxa@MIL-PDA-PEGTK for 4 h and then irradiated with 808 nm laser. Microscopy images were taken after stained with LIVE/DEAD kit (scale bar is 100 μm). (E) Cell viability of L02 cells treated with Oxa@MIL-PDA-PEGTK at different concentrations. (F) Cell viability of PLC/PRF/5 cells treated with different NPs.

