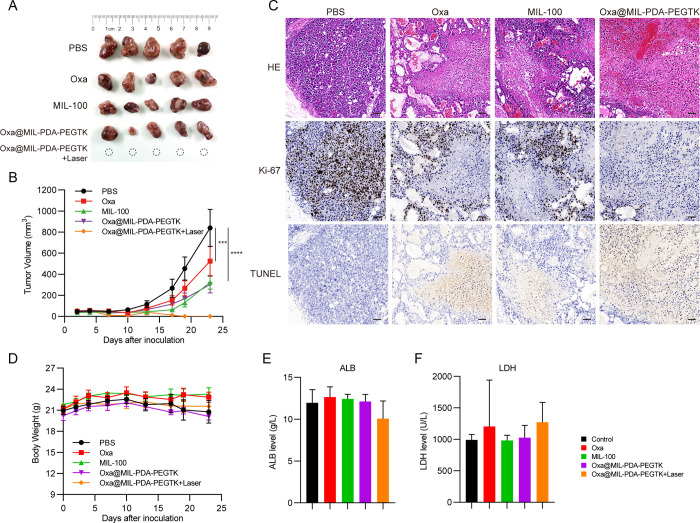
Figure 6.
Enhanced in vivo therapeutic effect and reduced side effects. (A) Gross images of resected tumors from PLC/PRF/5-bearing mice at day 23. (B) Tumor volume curves with indicated treatments (mean ± SEM). (C) Body weight changes of nude mice with indicated treatments (mean ± SEM). (D) Microscopy images of tumors with H&E staining, Ki-67 staining, and TUNEL staining after indicated treatments. (E) Biochemical marker analysis of ALB and LDH levels in blood serum of mice with indicated treatments. ALB, albumin; LDH, lactate dehydrogenase.

