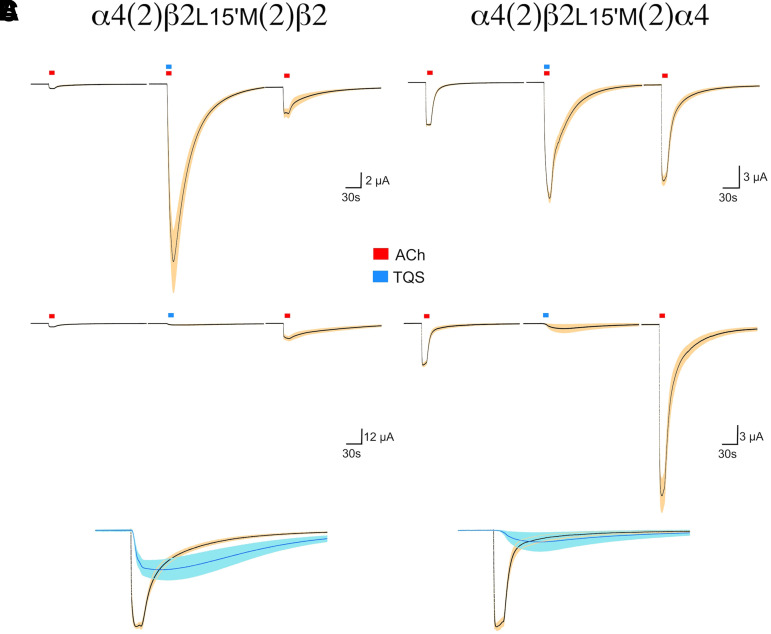
Fig. 2.
Averaged data from HS α4(2)β2L15’M(2)β2 receptors (left) and LS α4(2)β2L15’M(2)α4 receptors (right). (A) Cells were treated with control applications of ACh (red bars) and then after washout ACh coapplied with 30 µM TQS (blue bars) and then another application of ACh. ACh controls were 10 µM for the HS receptors and 100 µM for the LS receptors. The data are the averages of seven cells for each receptor subtype. Scale bars are based on the average initial ACh controls that were used for normalization (see Materials and Methods). (B) Averaged responses of HS and LS receptors to ACh and then 30 µM TQS applied alone, followed by another ACh application. The data are the averages of eight cells for the HS configuration and seven cells for the LS configuration. (C) Superimposition of the ACh preapplication controls and the responses to TQS alone taken from the traces in (B).

