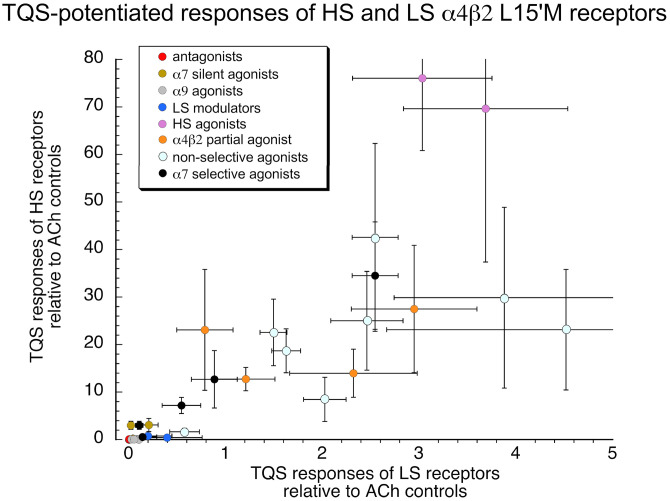
Fig. 3.
The TQS potentiated responses to all of the test compounds. The HS receptor responses, normalized to their ACh controls, are plotted relative to the scale on the y-axis. The LS receptor responses, normalized to their ACh controls, are plotted relative to the scale on the x-axis. All points are averages (± S.D.). The n values are provided in Table 1. The various classes of drugs are color-coded as indicated.

