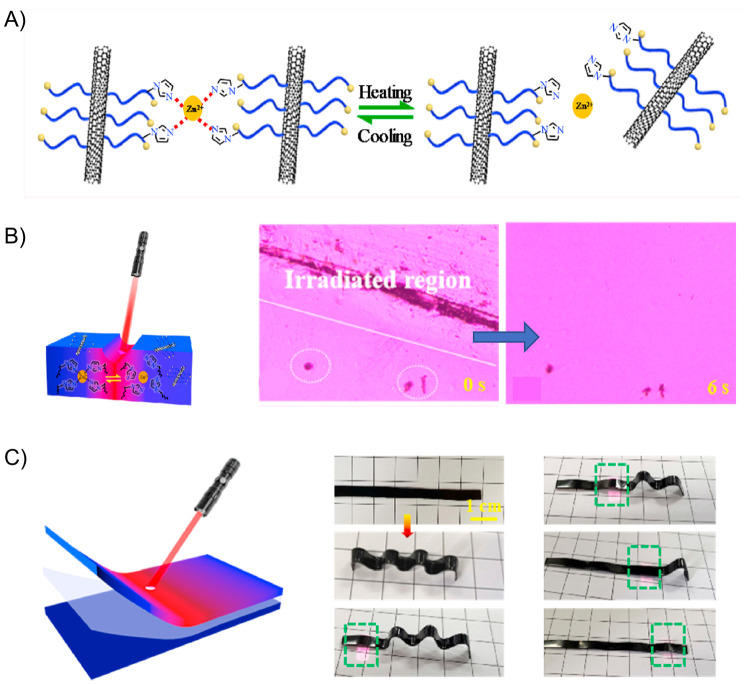
Figure 20.
(A) Schematic diagram of the association and disassociation process of Zn2+/vinyl imidazole (VI) metal–ligand bonds in response to stimulus. (B) NIR light driven self-healing process followed by POM and (C) targeted shape-morphing process in waved shape of the CNTsx-g-CPy/Zn sample. Adapted with permission from ref (212). Copyright 2021 Elsevier.

