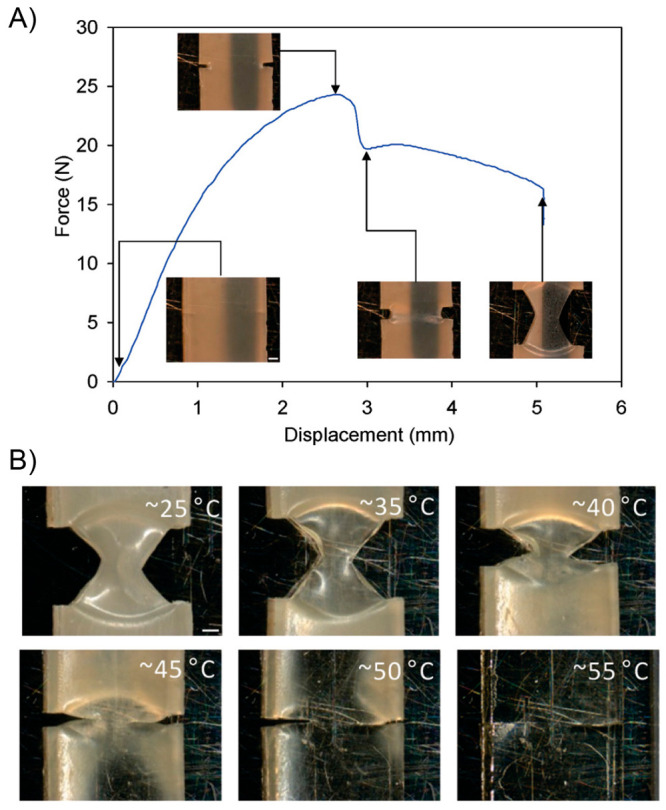
Figure 27.

(A) Force vs displacement curve of a notched sample (i-PCL50:n-PCL50) showing micrographs of deformation and crack growth clamped in the Linkam tensite stage. (B) Snapshots of crack closure and crack rebonding when the sample was unclamped from the Linkam tensile stage and heated to the temperatures shown above (scale bar = 500 μm). Adapted with permission from ref (225). Copyright 2011 American Chemical Society.
