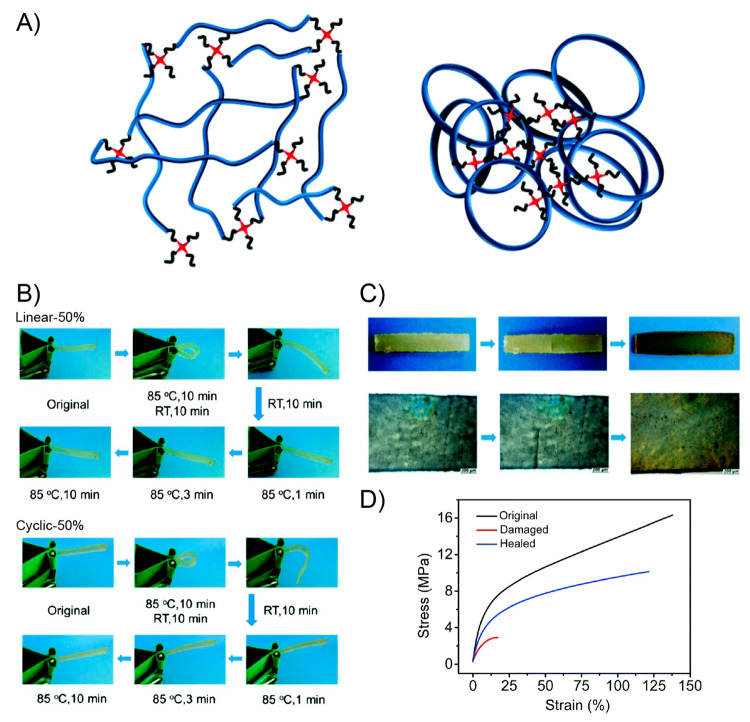
Figure 34.
(A) Schematic representation of the network difference between linear (left) and cyclic (right) polymer-made PUs. (B) Pictures showing the shape-memory properties of linear-50% (up) and cyclic-50% (bottom) samples. (C) Digital and optical microcopy images of cyclic-50% sample during the thermally driven healing process. (D) Stress–strain curve for the original, damaged and healed cyclic-50% sample. Adapted with permission from ref (277). Copyright 2016 Royal Society of Chemistry.

