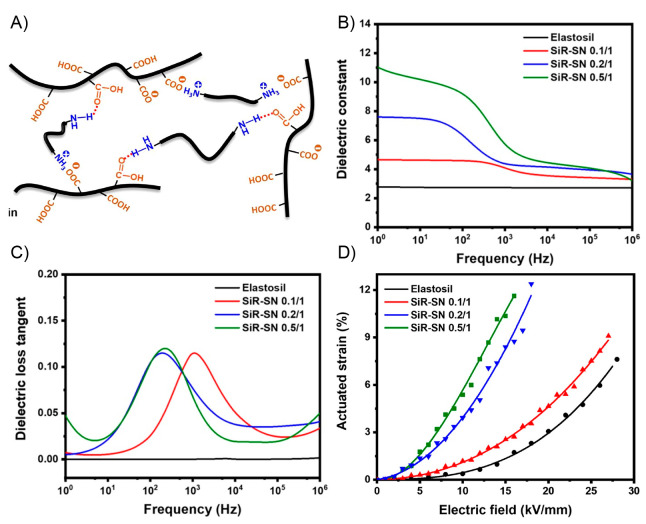
Figure 44.
(A) Schematic showing the interactions leading to the formation of SiR-SN, (B) dielectric constant, (C) dielectric loss tangent versus frequency of reference Elastosil and SiR-SN, and (D) Actuated strain of reference Elastosil and SiR-SN. Adapted with permission from ref (338). Copyright 2020 Elsevier.

