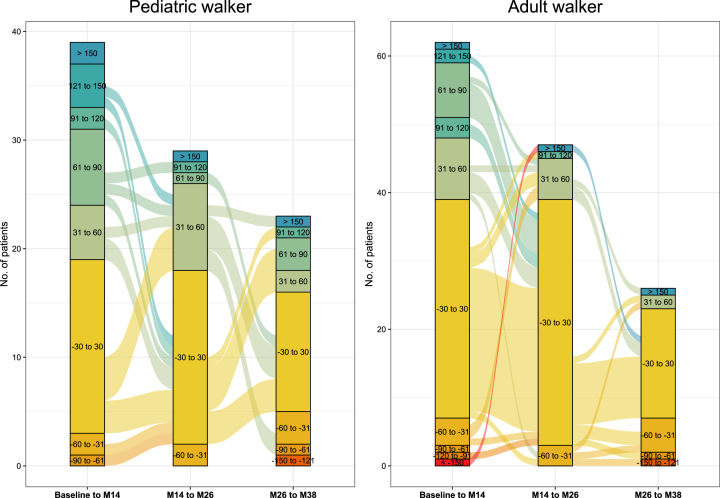
Fig. 2.
Responder analysis 6MWT. Responder analysis for pediatric walkers and adult walkers. Colors indicate response groups according to changes in 6MWT per time-period (baseline-m14, m14-m26, m26-m38). Lines between columns indicate the progression of patients over time with improvements or worsening in walking distance.

