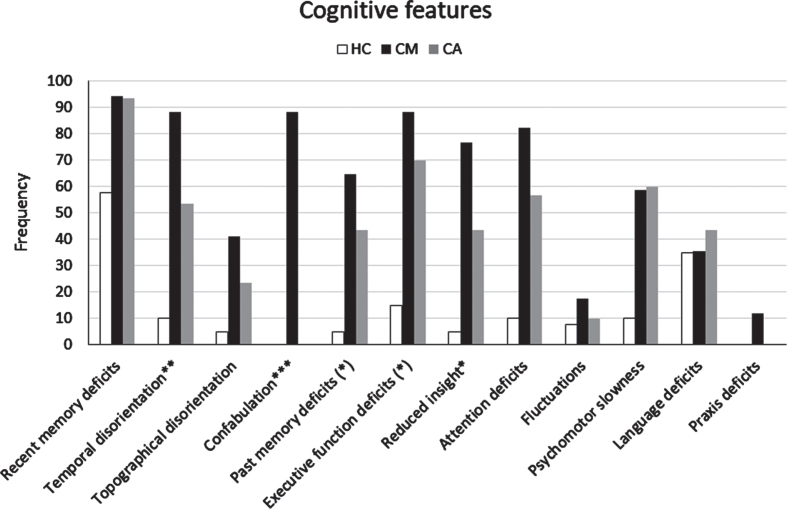
Fig. 2.
Frequency of cognitive features detected by clinical assessment (informant report and/or NPE) in the CM-AD group of patients compared to those in the CA-AD and HC group. *indicates a statistically significant difference CM > CA at p < 0.05. **indicates a statistically significant difference CM > CA at p < 0.01. ***indicates a statistically significant difference CM > CA at p < 0.001. (*) indicates a difference CM > CA with tendency to significance.

