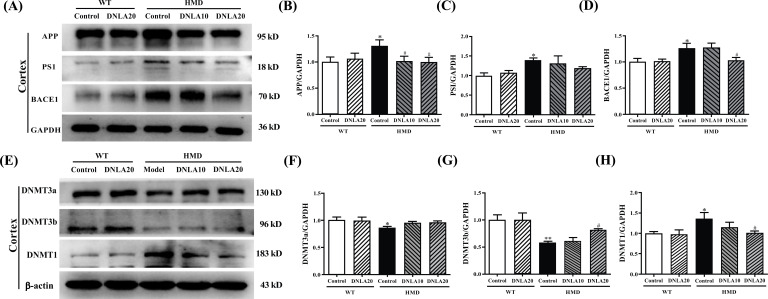
Fig. (4).
Effect of DNLA on the expression of DNMTs. (A) Representative western blot images of DNMTs in the cortex. (B) The expression level of DNMT3a protein in the cortex. (C) The expression level of DNMT3b protein in the cortex. (D) The expression level of DNMT1 protein in the cortex. (E) Representative western blot images of DNMTs in the hippocampus. (F) The expression level of DNMT3a protein in the hippocampus. (G) The expression level of DNMT3b protein in the hippocampus. (H) The expression level of DNMT1 protein in the hippocampus. Note: data are mean ±SEM, n = 4, *p < 0.05, **p < 0.01 vs. Control group; #p < 0.05 vs HMD group.

