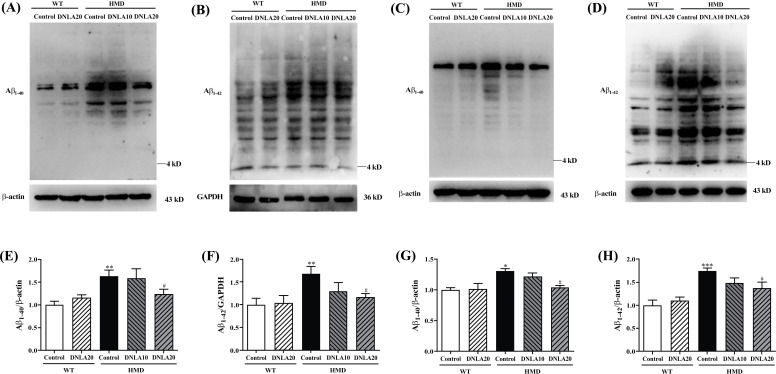
Fig. (8).
Effect of DNLA on Aβ1-40 and Aβ1-42 level in the cortex and hippocampus tissue. (A) Representative western blot images of Aβ1-40 level in cortex. (B) Representative western blot images of Aβ1-42 level in cortex. (C) Representative western blot images of Aβ1-40 level in the hippocampus. (D) Representative western blot images of Aβ1-42 level in the hippocampus. (E) The Aβ1-40 level in the cortex. (F) The Aβ1-42 level in the cortex. (G) The Aβ1-40 level in the hippocampus. (H) The Aβ1-42 level in the hippocampus. Note: data are mean ±SEM, n = 4, *p < 0.05 **p < 0.01, ***p < 0.001 vs. Control group; #p < 0.05 vs. HMD group.

