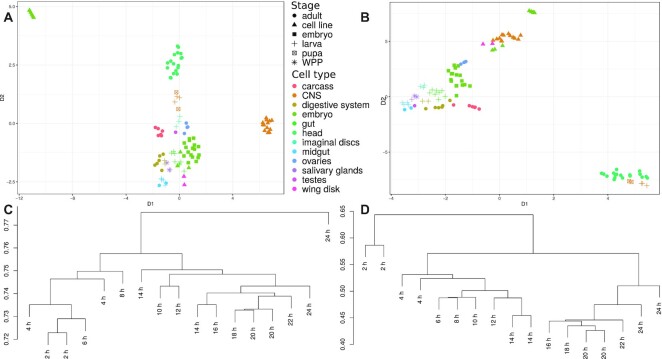
Figure 4.
Comparison of CIRCexplorer2 and CYCLeR for the D. melanogaster transcriptome sets. The comparison is made based exclusively on circRNA abundance estimations. (A) and (B) show the UMAP dimensional scaling of the abundances inferred by CIRCexplorer2’s BSJ detection module and CYCLeR for all 103 samples of the Lai dataset. (C) (CIRCexplorer2) and (D) (CYCLeR) show a dendrogram of the subset of data corresponding to embryo stages which are based on between sample distance calculations. The scale of the dendrograms represents the samples’ distances.

