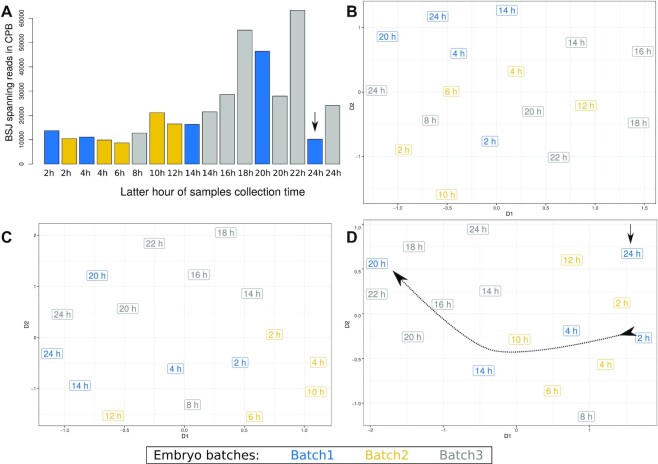
Figure 5.
Batch effect in Lai 2014 dataset. (A) The BSJ-spanning reads count per samples in counts per billion (CPB). (B–D) The UMAP dimensional scaling of the abundances estimated by CIRCexplorer2 BSJ detection module, sailfish-cir and CYCLeR respectively. We annotated the experimental batches based on SRA accession numbers and colour-coded them. Only the CYCLeR results reflect the underlying biological trend in the distribution of the sample points indicated by the dotted curve. The trend is not perfect, due to the influence of strong experimental biases, but sufficient to reliably identify outliers (marked with straight arrow) and to improve downstream analyses.

