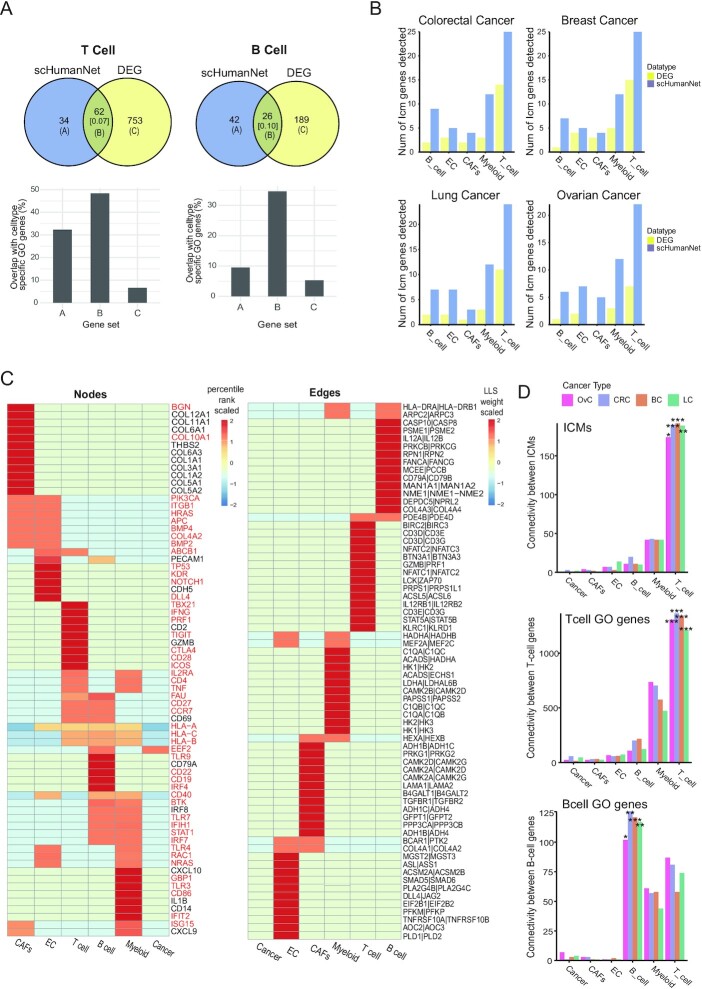
Figure 3.
Prediction of cell-type-associated genes via differential expression analysis and network centrality by scHumanNet. (A) Overlap of significant DEGs and significant hub genes for B- and T-cell networks in breast cancer (q-value < 0.05). The numbers in square brackets correspond to Jaccard indices. Overlap of genes specific for B- and T-cell functions was assessed for prediction by hub genes and DEGs (set A and set C) and their intersection (set B). (B) Number of ICMs retrieved via FindAllMarkers() (DEG) and FindDiffHubs() (scHumanNet) in different cancer types. (C) Heat map showing the percentile rank of top 15 hub genes (nodes) and interactions (edges) of each breast cancer network. Values were scaled per row. Results for other cancer types are reported in Supplementary Figure S6. Genes highlighted in red were not among the top 50 DEGs retrieved by the FindAllMarkers() function in the Seurat package. (D) Within-group connectivity between ICMs, T-cell GO genes, and B-cell GO genes for all annotated cell types in scHumanNet and for each cancer type (OvC, ovarian cancer; CRC, colorectal cancer; BC, breast cancer; LC, lung cancer) (*P < 0.05, **P < 0.01, ***P < 0.001 by non-parametric test)

