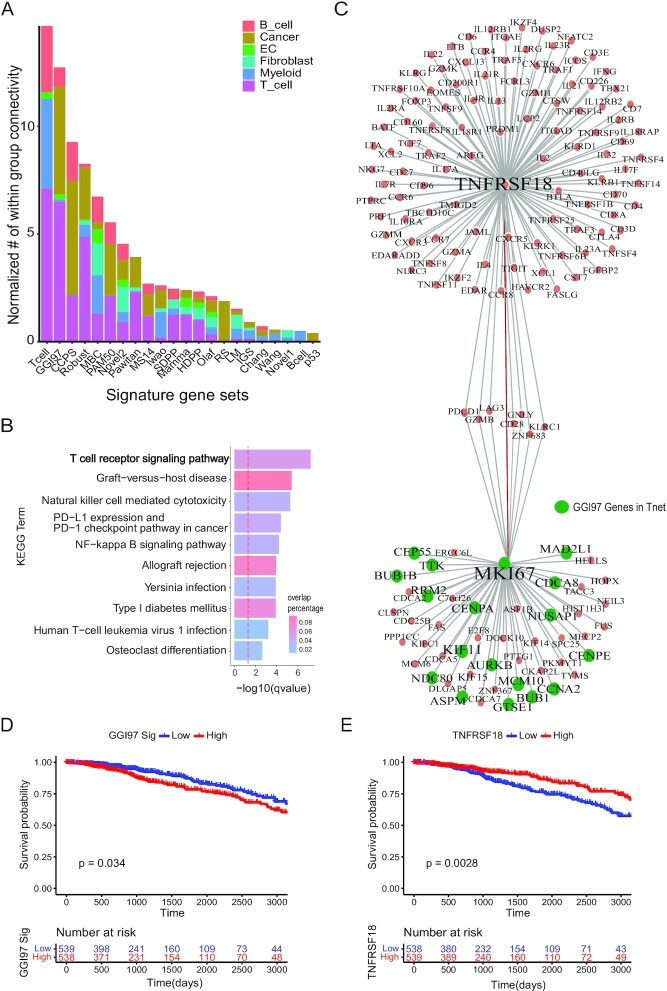
Figure 4.
Deconvolution of breast cancer signatures to cell types with scHumanNet. (A) Normalized within-group connectivity of each breast cancer signature in six cell-type-specific networks by scHumanNet. Within-group edge counts were normalized to the number of genes for each cell-type-specific network. Cancer signatures with at least 10 genes are presented. (B) Gene set enrichment analysis with the KEGG pathway for the top 30 direct neighbor genes of GGI97 signature genes. The red vertical line corresponds to a q-value of 0.05 corrected with the Benjamini–Hochberg method. (C) Network of genes neighboring MKI67 and GITR (TNFRSF18) in the context of breast cancer T cells by scHumanNet. Green nodes denote GGI97 genes. (D, E) Kaplan–Meier plot for TCGA-BRCA cohort based on the average expression of 76 signature genes (D) or the expression of GITR (TNFRSF18) (E). Clinical samples were divided into high and low groups by median value.

