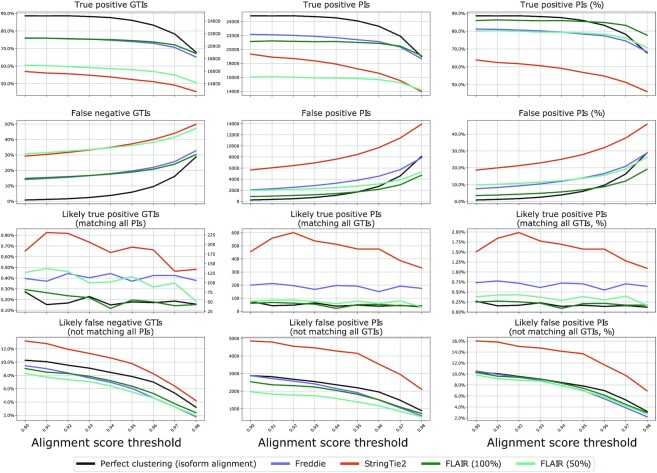
Figure 6.
Graph-based accuracy results of the simulated dataset experiment. The first and second rows plot the count/percentages of isoforms belonging to mixed clique components (category i) and non-mixed components (category ii). The last two rows describe mixed ambiguous components (category ii). The left column presents the absolute counts and percentages for GTIs in each type of component for all graphs. The middle and right columns present the absolute and percentage for PIs in each type of component for all graphs.

