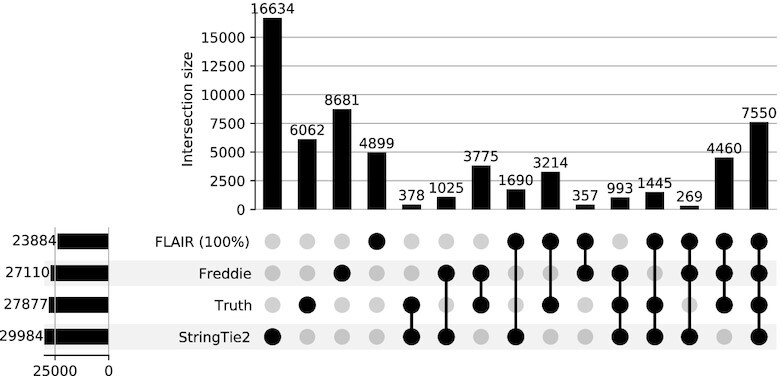
Figure 7.

Simulated human dataset. UpSet plot showing the intersection sizes between the sets of isoforms predicted by different tools or present in the simulated ground truth using their exon intervals as a condition of equivalence. Note that UpSet plots present the same information as Venn diagrams but have the advantage of representing each intersection as a bar with its height corresponding to the intersection’s size. The members of each intersection are indicated by the solid black circles under each bar. The total size of each tool’s predictions (i.e. the number of isoforms predicted by each tool) are shown on the bar graph on the left.
