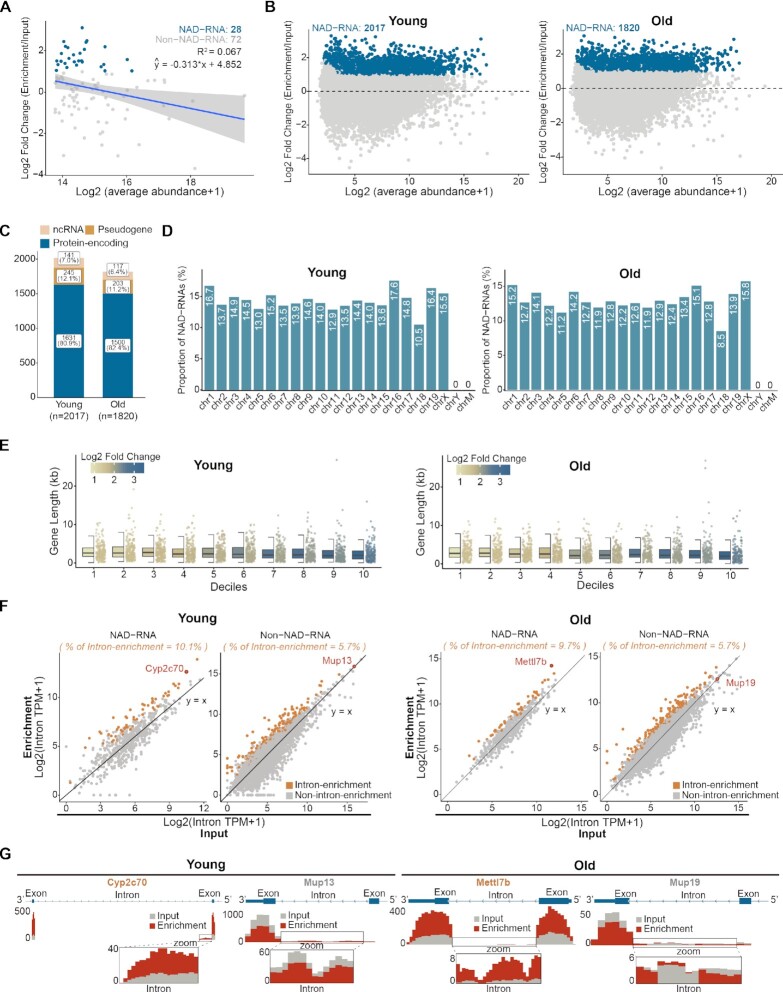
Figure 5.
Epitranscriptome-wide profiling of NAD-RNAs by ONE-seq. (A) Scatter plots showing no positive correlation of the enrichment levels and transcript abundances among the top 100 abundant transcripts from livers of young mice (2-month). Blue dots represented the NAD-RNAs identified by ONE-seq. The blue line was the linear regression fits and grey shade area was the 95% confidence interval. (B) Scatter plots showing NAD-RNAs (blue dots) identified by ONE-seq in young (left panel) and aged (right panel) animals. Two-fold enrichment of read counts was used as the cutoff. 2017 and 1820 NAD-RNAs from young (2-month) and aged (18-month) mouse livers, respectively. Total RNAs were from mouse livers of indicated age. (C) NAD capping on different RNA types, with most occurrence on protein-encoding genes (blue), but also on non-coding RNAs (orange) and pseudogenes (yellow). (D) Chromosomal distribution shows that NAD-RNAs are derived from genes localized on autosomes and X chromosomes, but not from the Y chromosome and the mitochondrion genome. (E) From 10 deciles based on enrichment, genes with short length tend to have increased modification of NAD. (F) NAD-RNA tends to have higher ratio of intron retention than non-NAD capped forms. (G) Genome browser views illustrate the presence of intron read counts in select NAD-capped genes.

