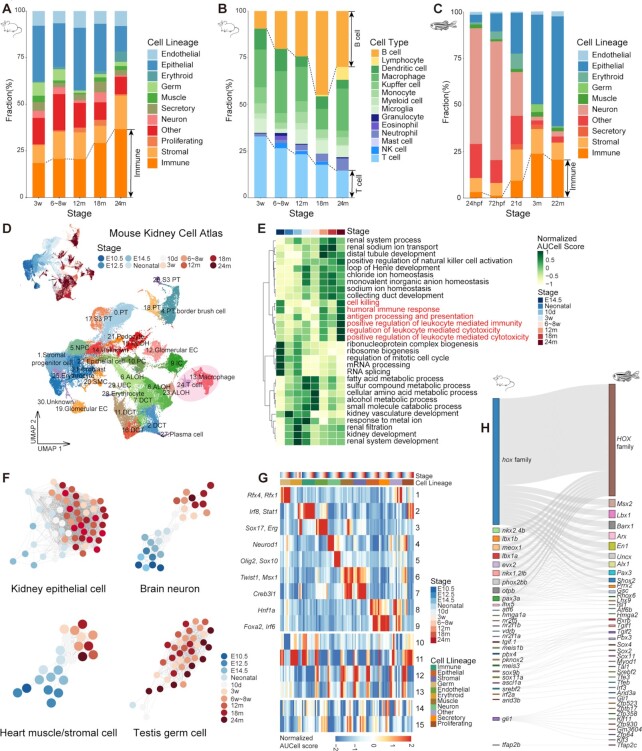
Figure 2.
Time-related signatures across mice, zebrafish and Drosophila. (A) Bar plot showing the fraction of cell lineages for five life stages of mouse. (B) Bar plot showing the fraction of immune cell types for five life stages of mouse. (C) Bar plot showing the fraction of cell lineages for five life stages of zebrafish. (D) UMAP visualization of the Mouse Kidney Cell Atlas across all stages of mouse kidney, colored by stage and cell type (PT, proximal tubule cell; NPC, nephronic progenitor cell; DLOH, descending loop of Henle; ALOH, ascending loop of Henle; PC, distal collecting duct principal cell; IC, collecting duct intercalated cell; DCT, distal convoluted tubule cell; EC, endothelial cell.) (E) Heatmap showing normalized GO AUCell Scores of the Mouse Kidney Cell Atlas across all stages of mouse kidney. (F) Relatedness network for the main cell types of mouse kidney, brain, heart and testis based on similarity of regulon activities. Each dot represents the aggregated cell type within each stage (see Supplementary Methods) and colored by stage. Only nodes with > 50 cells are selected. The edges between nodes represent the Spearman correlation coefficient calculated based on the aggregated regulon activity scores and filtered with Spearman correlation coefficient > 0.9. (G) Heatmap showing the aggregated module activities of TFs clustered by fuzzy c-means from mice. (H) Sankey plot showing the homologous relationships among vertebrate developmental-related TFs.

