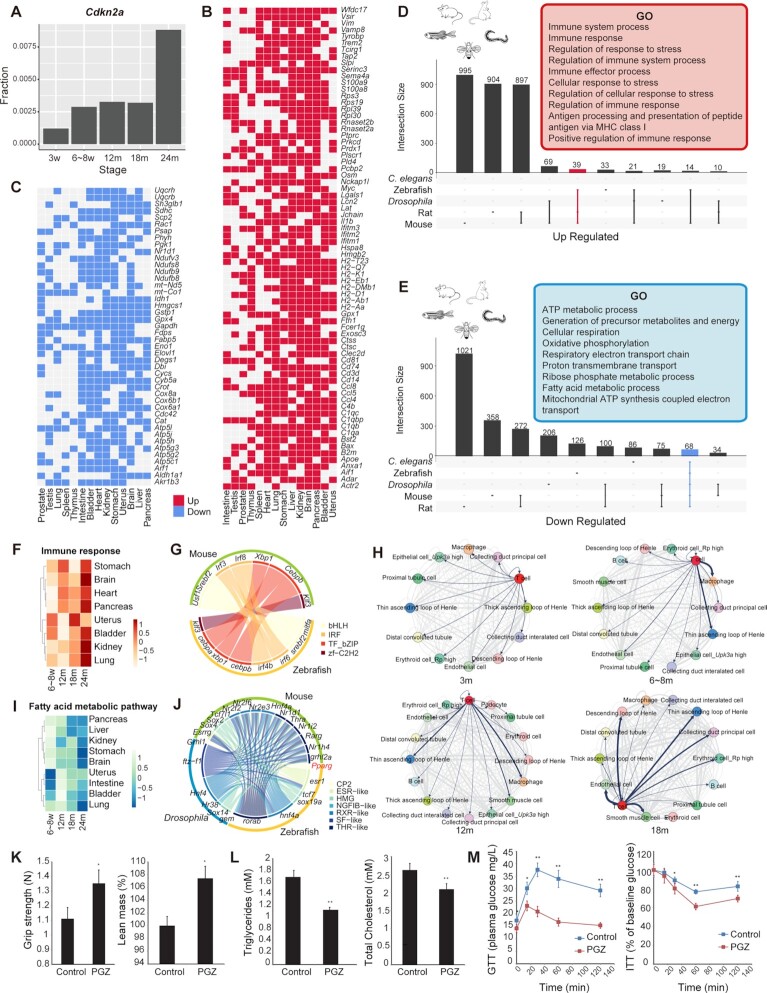
Figure 3.
Aging-related signatures across multiple species. (A) Bar plot showing the fractions of cells expressing Cdkn2a at different mouse life stages. (B) Heatmap showing consensus up-regulated genes in 14 tissues of mice. The red cell represents up-regulated genes in the aging process. (C) Heatmap showing consensus down-regulated genes in 14 tissues of mice. The blue cell represents down-regulated genes in the aging process. (D) UpSet plot showing GO terms for up-regulated genes in multiple species. Representative GO terms for up-regulated genes in mice, rats and zebrafish are shown in the red box. (E) UpSet plot showing GO terms for down-regulated genes in multiple species. Representative GO terms for down-regulated genes in five species are shown in the blue box. (F) Heatmap showing normalized AUCell score of Immune response in eight mice tissues during four aging stages. (G) A circle plot showing the up-regulated homologous TFs between mice and zebrafish, colored by TF family. (H) Ligand and receptor analysis of 3w, 6–8w, 12m and 18m kidneys using CellPhoneDB. Line thickness indicates the degree of association between cell types. (I) Heatmap showing normalized AUCell score of the Fatty acid metabolic pathway in eight mice tissues during four aging stages. (J) Circular plot showing the down-regulated homologous TFs among the three species, colored by TF family. (K) Bar plot showing that PGZ reverses aging-induced frailty and sarcopenia in mice by increasing grip strength and lean mass in aging mice (n = 5). (L) Bar plot showing that PGZ reverses aging-induced hyperlipidemia in mice by decreasing triglycerides and total cholesterol in aging mice (n = 5). (M) Line chart showing that PGZ reverses aging-induced insulin resistance (n = 5).

