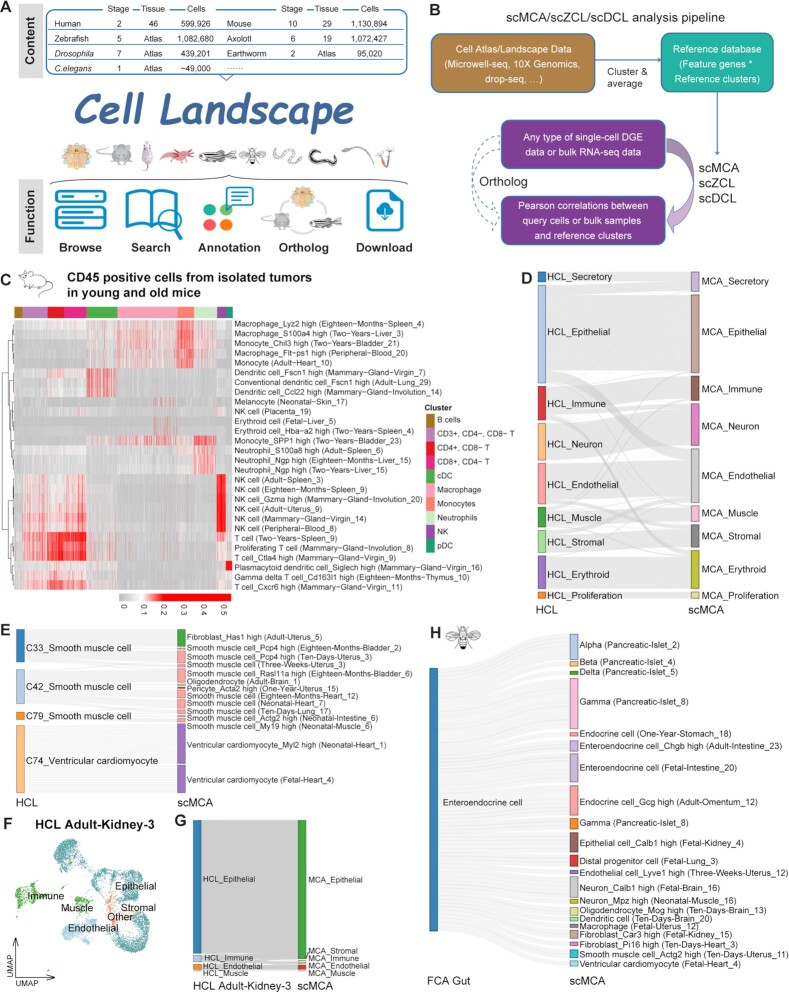
Figure 4.
The main function of Cell Landscape. (A) Overview of the Cell Landscape website construction. (B) Diagram showing the pipeline for scMCA, scZCL, scDCL and their cross-species analysis. (C) scMCA results for isolated tumors in young (6–8w) and old (20–22m) mice (n = 9966 cells). Each row represents one cell type in our reference. Each column represents data from a single cell. Pearson correlation coefficient was used to evaluate cell type gene expression similarity. Red indicates a high correlation; gray indicates a low correlation. (D) The Sankey plot showing the highest correlation coefficient pairs in each cell type between HCL and scMCA, merged by cell lineage. (E) The Sankey plot showing the highest correlation coefficient pairs in each cell type between muscle cells in HCL and corresponding cell types in scMCA. (F) t-SNE visualization of Adult-Kidney-3 in HCL, colored by cell lineage. (G) The Sankey plot showing the highest correlation coefficient pairs in each cell type between Adult-Kidney-3 in HCL and scMCA, merged by cell lineage. (H) The Sankey plot showing the highest correlation coefficient pairs in each cell type between EEs in FCA gut and corresponding cell types in scMCA.

