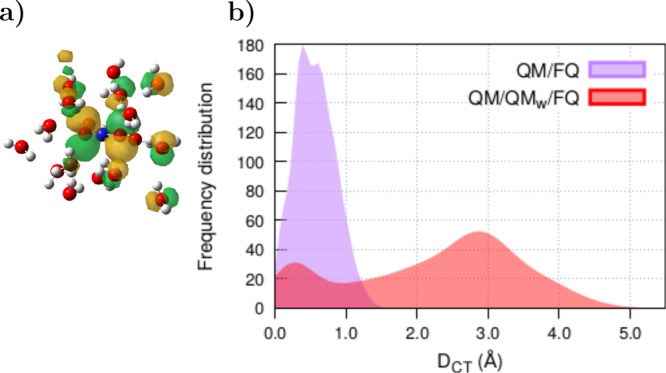
Figure 9.

(a) Picture of one of the molecular orbitals involved in the UV–vis transitions of NO2– in water, obtained with the QM/QMw/FQ approach. FQ water molecules are omitted. (b) Distribution of DCT indices computed with QM/FQ and QM/QMw/FQ on 200 snapshots extracted from MD trajectories of solvated NO2–. Twelve excited states are taken into account in each snapshot. NO2– was freely allowed to move during MD simulations. QM level: CAM-B3LYP/6-311++G(d, p). Numerical results are taken from ref (65).
