Fig. 3.

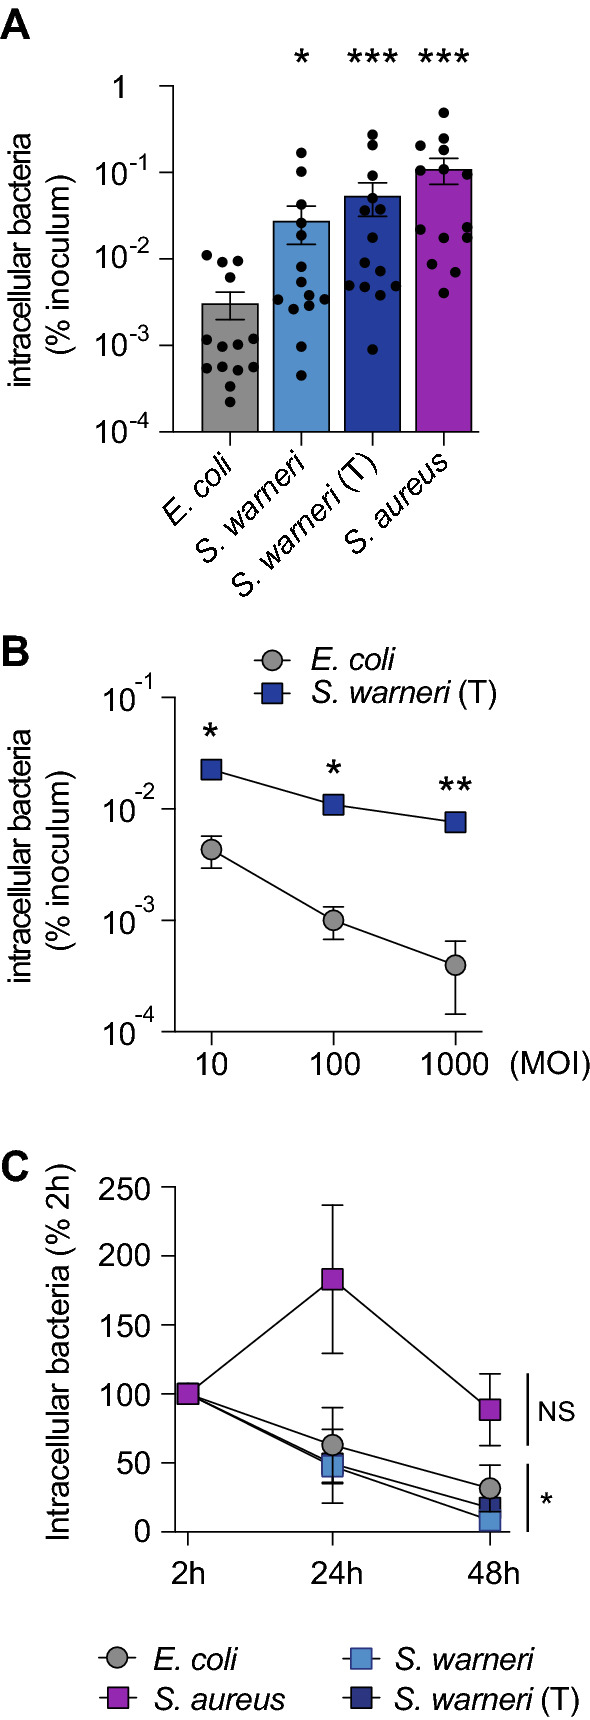
Internalization efficiency and survival of S. warneri in nonphagocytic cells. A Quantification of intracellular bacteria in Caco2 cells (% of inoculum) (mean ± s.e.m.; n = 14; *P < 0.05; ***P < 0.001 vs. E. coli; Friedman test with Dunn’s correction). B Quantification of intracellular bacteria (% of inoculum) (mean ± s.e.m.; n = 3–4; *P < 0.05; **P < 0.01 vs. E. coli; 2-way ANOVA with Sidak’s correction). C Quantification of intracellular bacteria, expressed as the percentage of intracellular bacteria recovered at 2 h (mean ± s.e.m.; n = 6; NS: not significant; *P < 0.05 vs. 2 h; 2-way ANOVA with Sidak’s correction)
