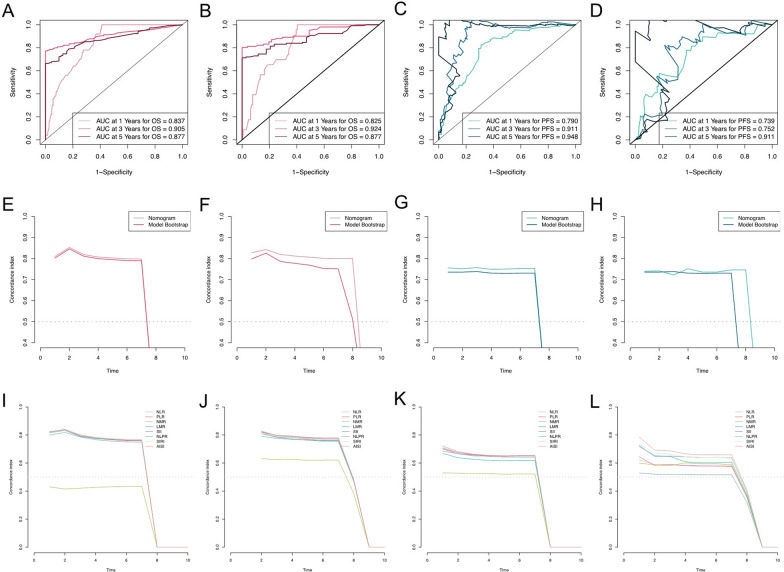
Fig. 4.
The prognostic performance of nomograms and the prognostic performance in patients with EC. The time-dependent ROC curves of the nomograms A for OS in the training cohort; B for OS in the validation cohort; C for PFS in the training cohort; D for PFS in the validation cohort. The time-dependent AUC curves of the nomograms E for OS in the training cohort; F for OS in the validation cohort; G for PFS in the training cohort; H for PFS in the validation cohort. The prognostic performance of the inflammatory marks in patients with EC. The time-dependent AUC curves of NLR, PLR, NMR, LMR, SII, NLPR, AISI, and SIRI I for OS in the training cohort; J for OS in the validation cohort; K for PFS in the training cohort; L for PFS in the validation cohort

