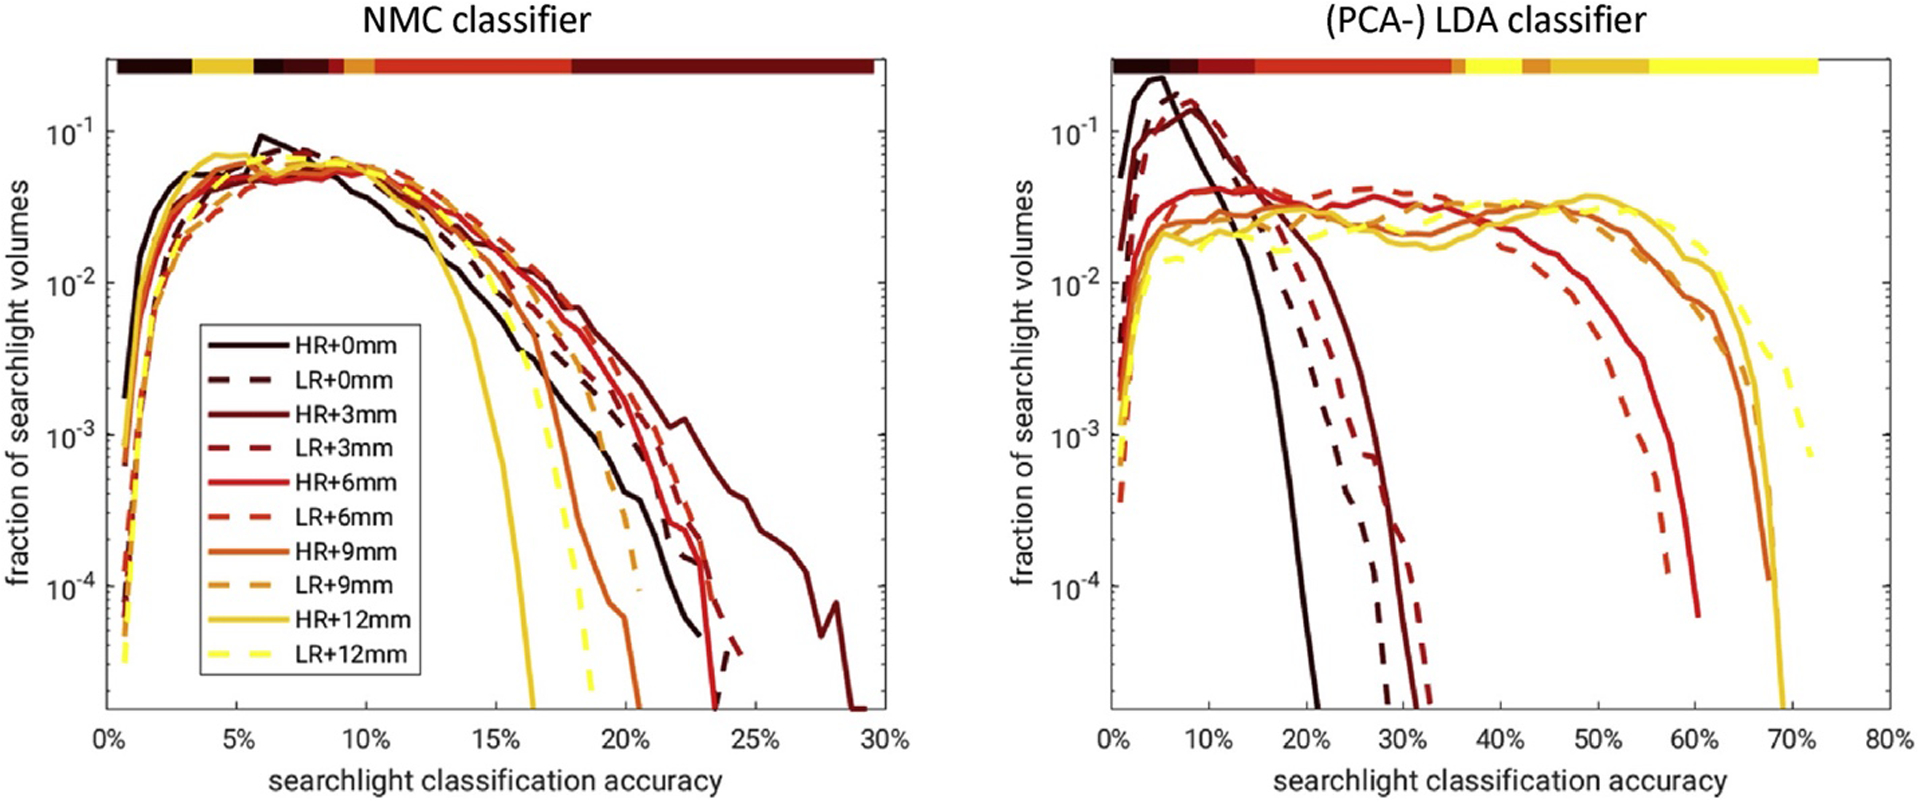
Fig. 5.

Smoothing shifted the distribution of searchlight CA. Left: A family of histograms was used to summarize the effect of smoothing on SL CA across SL locations and subjects. A log-scale helps resolve the right tail corresponding to SL locations of high CA, which are of particular interest. The color bar above denotes the highest curve for any given SL CA: 3 mm smoothing yielded the most SL locations with CA>20% for HR and LR data analyzed by the NMC classifier using a 8.4 mm SL diameter. Right: Analogous to the smoothing analysis of small global fROIs (Fig. 3), the PCA-regularized LDA classifier profited from much larger amounts of smoothing up to 12 mm FWHM.
