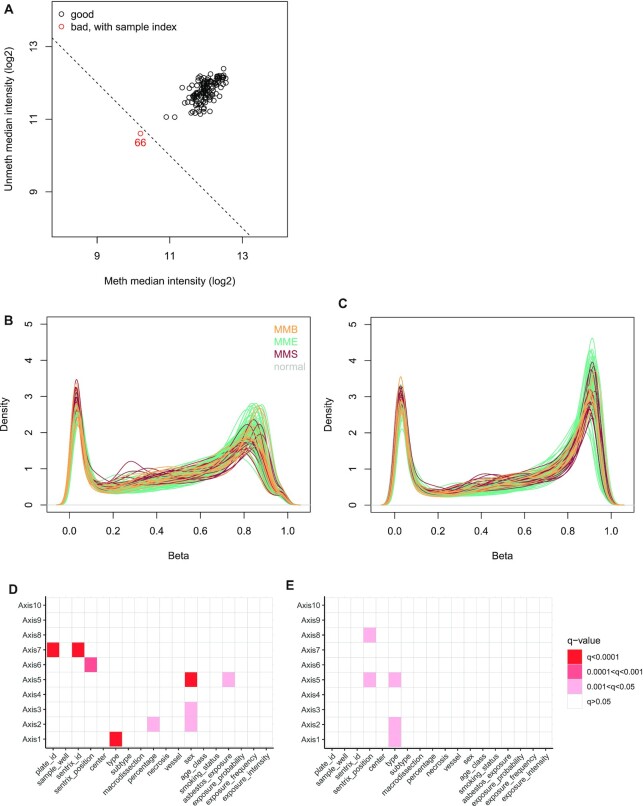
Figure 3:
Quality control of EPIC array sequencing data. (A) Signal intensity plot. Log2 methylated and unmethylated median signal intensity plot of 140 samples. One sample (colored red) fell below the cutoff of 10.5 and was subsequently removed from analysis. (B) Prenormalization β density plot. The β density plot of 140 samples across 865,859 probes, colored by tumor/normal type, prior to functional normalization. (C) Postnormalization and filtering β density plot. The β density plot of 139 samples across 781,245 probes, colored by tumor/normal type, following functional normalization and removal of cross-reactive probes, sex chromosome probes, single-nucleotide polymorphism probes, and failed (P-detection > 0.01) probes. (D) Association of technical and clinical variables with prenormalization principal components. Association of technical and clinical variables with principal components 1 to 10, for 122 samples. Principal components calculated from M-values of 863,381 prenormalized probes. (E) Association of technical and clinical variables with postnormalization principal components. Principal components calculated from M-values of 781,245 probes following functional normalization and probe removal.

