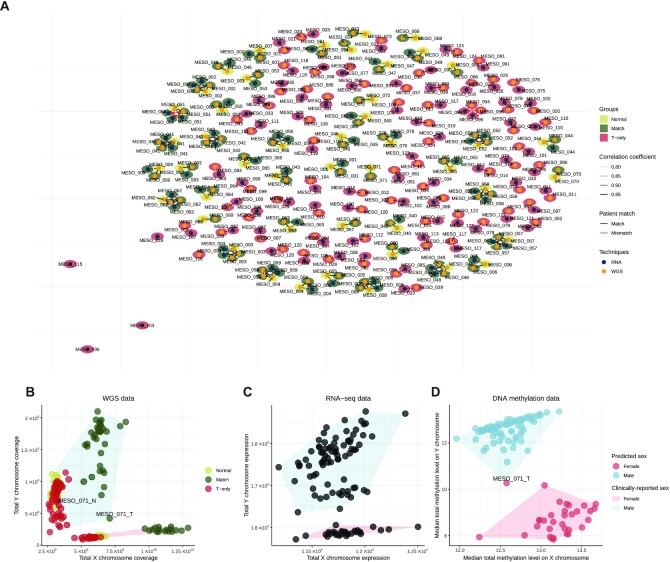
Figure 6:
Applications of data validation using multiomics data. (A) Network of matching WGS and RNA-seq samples, as computed by software NGSCheckmate. Edge transparency corresponds to the Pearson correlation r between single-nucleotide polymorphism panel allelic fractions; node color and surrounding color correspond respectively to the techniques (WGS or RNA-seq) and to the tissue type (normal, matched samples, or T-only samples). (B–D) Sex reclassification and multiomic validation of reported clinical sex. (B) Total exome reads coverage on the X and Y chromosomes for each sample. (C) Total expression level of each sample on the X and Y chromosomes (in variance-stabilized read counts). (D) Median methylation array total intensity on the X and Y chromosomes. In panel (B), point colors correspond to the WGS groups: normal samples in light green, tumor samples with matched normals (Match) in dark green, and tumor samples without matched normal (T-only) in red. In each panel, filled polygons correspond to the sexes given by the clinical annotations (blue for male, red for female). In panel (D), point colors correspond to the sexes predicted by the DNA methylation QC. Samples with discordant reported clinical sex and molecular patterns on sex chromosomes are indicated.

