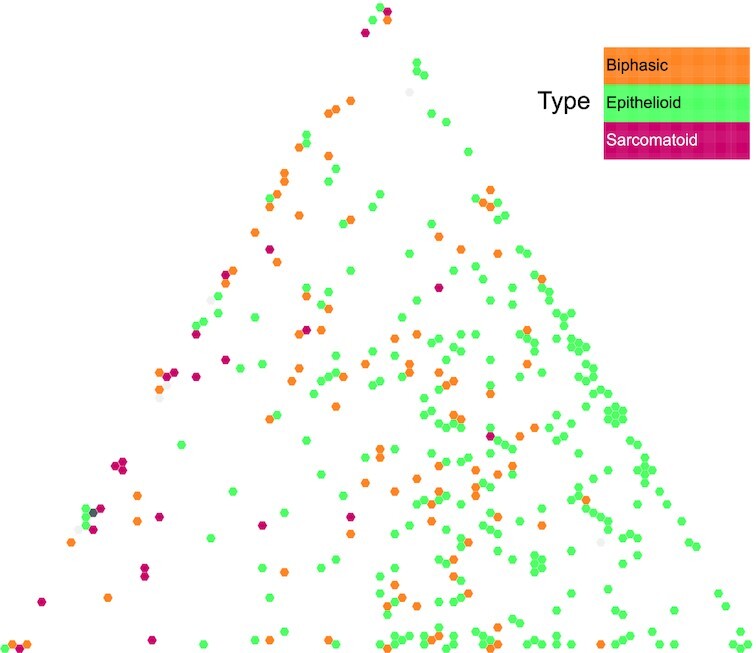
Figure 7:

MPM molecular phenotypic map. Screen capture from the TumorMap portal, using the hexagonal grid view, each point representing a MPM sample in the triangular phenotypic space: cell division (left vertice), tumor–immune interaction (top vertice), and acinar phenotype (right vertice). Point colors correspond to the histologic types and can be interactively changed by the users on the web portal.
