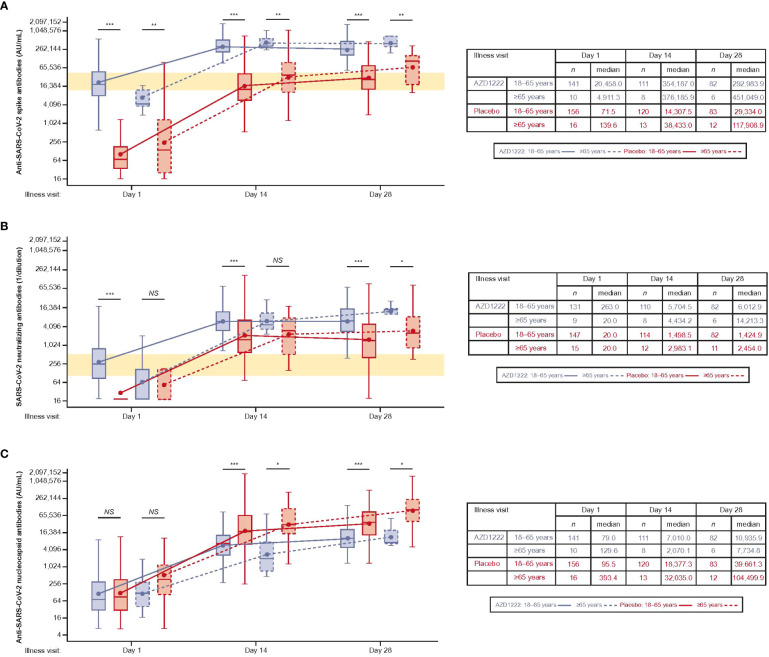
Figure 3.
The kinetics and magnitude of the breakthrough anti-SARS-CoV-2 antibody response are impacted by age and vaccination status. Levels of anti-SARS-CoV-2 (A) spike-binding, (B) neutralizing, and (C) nucleocapsid antibodies in AU/mL. The bottom and top edges of the box indicate the first and third quartiles, the difference is the IQR, the line inside the box is the median, and the marker inside the box is the geometric mean. The whiskers that extend from the box indicate the minimum and maximum after removing outliers (i.e., datapoints >1.5 x IQR from the box). (A, B) Yellow shaded region denotes peak antibody titers observed during primary analysis [13].Statistical evidence between groups was determined by post-hoc two-tailed Mann-Whitney tests. Not significant (NS), p>0.05; *p ≤ 0.05; **p ≤ 0.01; ***p ≤ 0.001.

