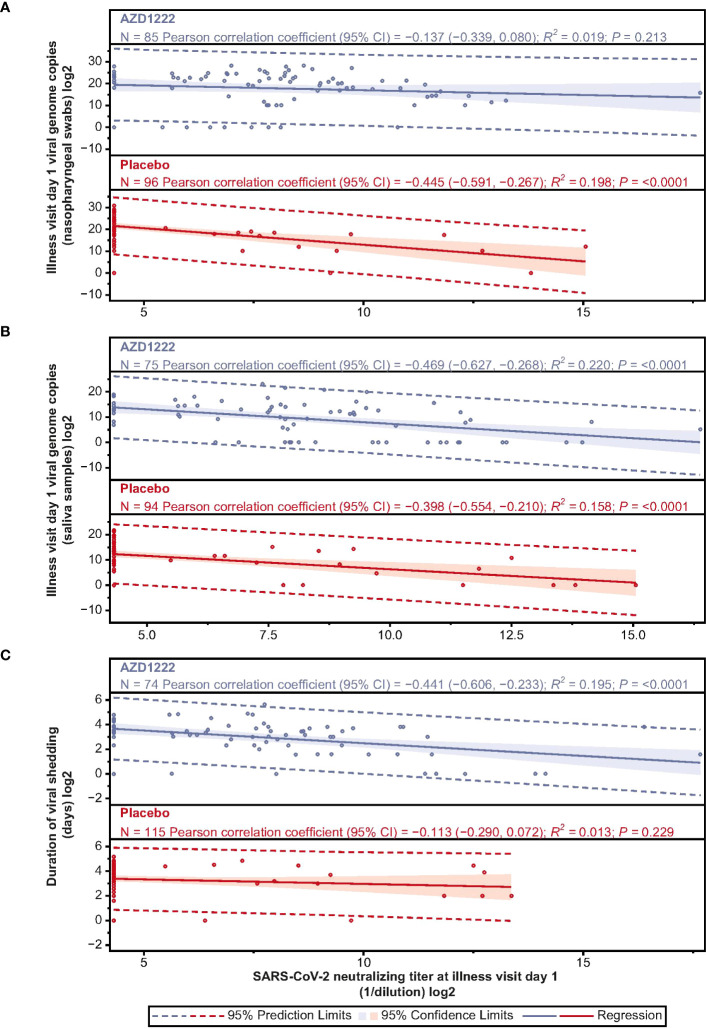
Figure 5.
Illness visit day 1 SARS-CoV-2 nAb titers display low-moderate negative correlations with SARS-CoV-2 virologic outcomes. Scatterplot analysis depicting the relationship between (A) SARS-CoV-2 viral load in nasopharyngeal swabs (B) SARS-CoV-2 viral load in saliva samples, and (C) duration of viral shedding in saliva (y-axes) and illness visit day 1 nAb titers (x-axes) in vaccinees and placebo recipients. Blue and red shading denotes 95% CI. Dotted line denotes 95% prediction limits. Clustering of participants along the y-axis occurs due to levels of serum anti-SARS-CoV-2 neutralizing antibody falling below the assay lower limit of quantification (LLOQ). LLOQ= 40 ID50. 50% of LLOQ =20 ID50.

