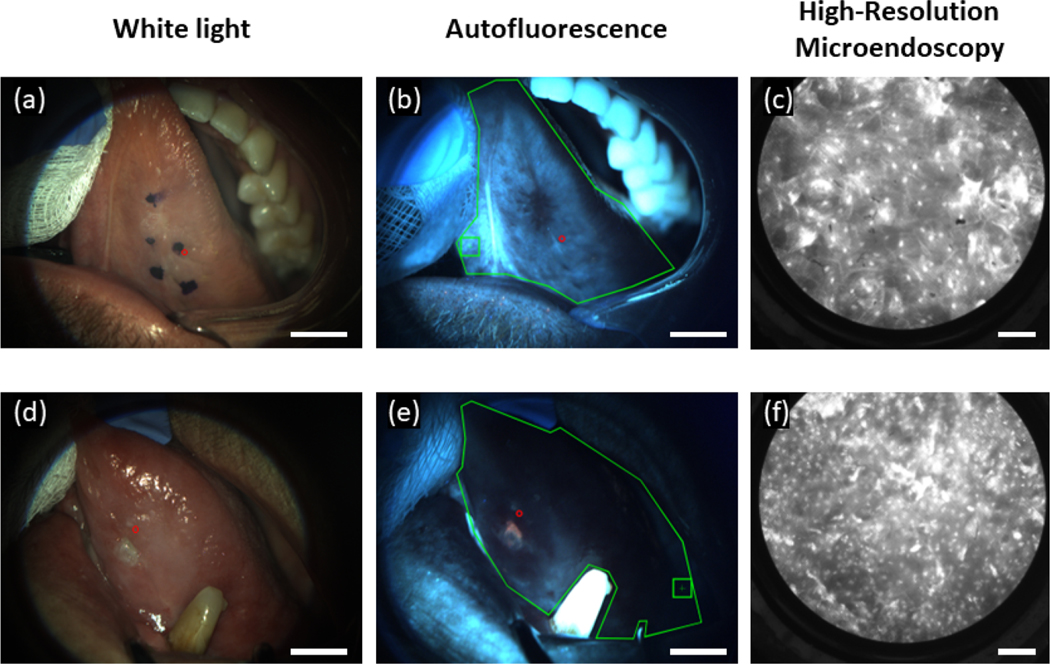
Fig. 1.
Multimodal optical images from the oral cavity of two patients with clinically ‘abnormal not suspicious’ sites that contained histologically confirmed mild dysplasia. (a-c) Images of the ventral tongue of Patient 1. (a) Widefield, white light image and (b) corresponding widefield autofluorescence image with site of interest indicated by a red circle. The normalized red-to-green autofluorescence ratio at the site was 1.15. (c) Corresponding high-resolution microendoscopy image of Patient 1 with 153.1 abnormal nuclei/mm2. (d-f) Images of the ventral tongue of Patient 2. (d) Widefield, white light image and (e) corresponding widefield autofluorescence image with site of interest indicated by a red circle. The red-to-green autofluorescence ratio at the site was 1.81. (f) Corresponding high-resolution microendoscopy image of Patient 2 with 226.8 abnormal nuclei/mm2. In the autofluorescence images the green outline denotes the oral mucosa while the green square encompasses the area used for normalizing the red-to-green ratio. Scale bar in high-resolution microendoscopy images represents 100 μm. Scale bar in the widefield images represents 1 cm. (For interpretation of the references to color in this figure legend, the reader is referred to the web version of this article.)

