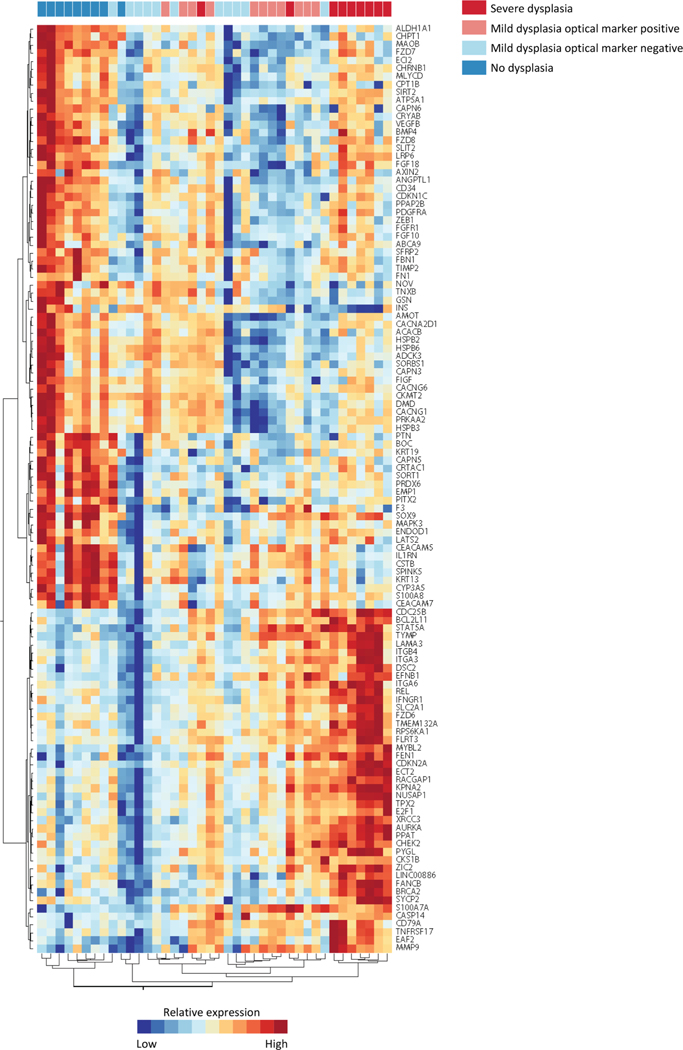
Fig. 3.
Clustering analysis of differential gene expression. Expression of genes differentially expressed between groups with no dysplasia and severe dysplasia (adjusted p-value < 0.01) examined across all samples. Hierarchical clustering analysis was performed on genes and samples. Heatmap scale for relative expression range corresponds to range within each individual gene.

