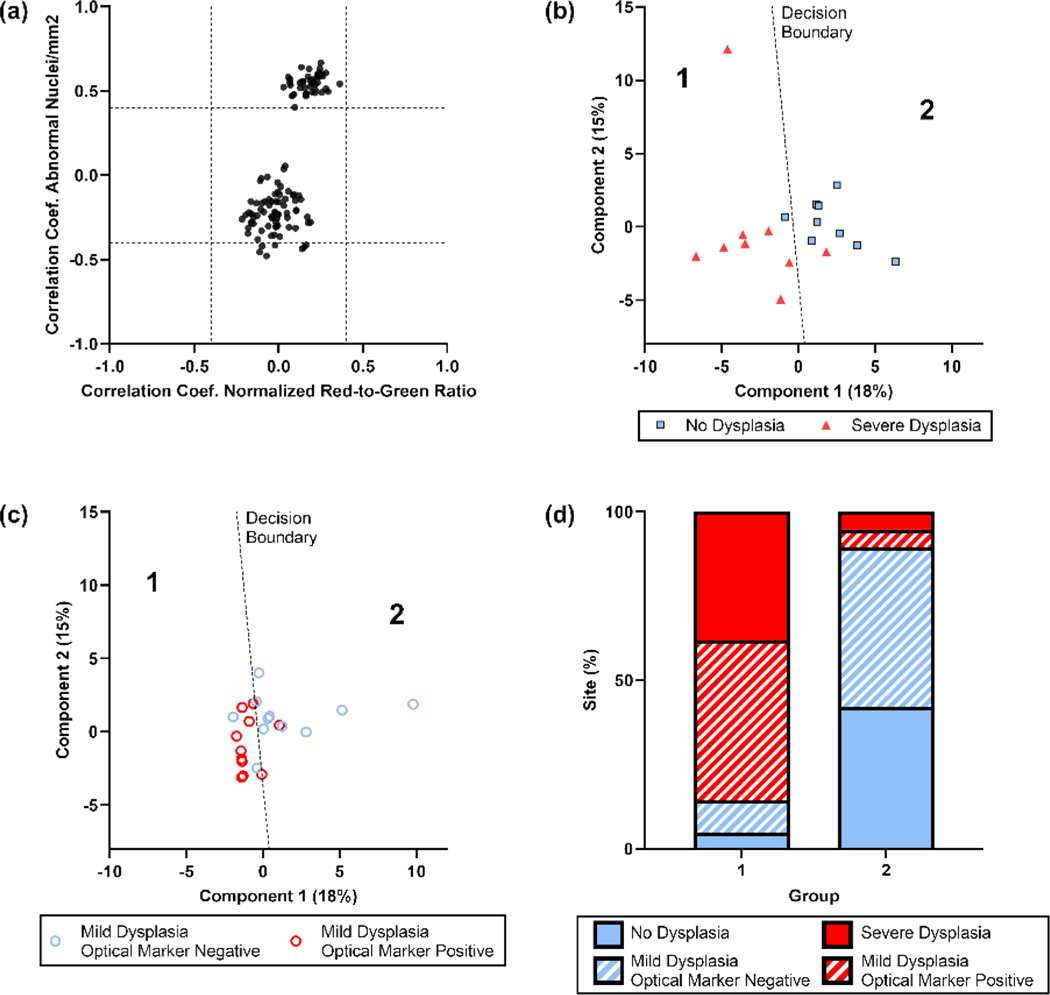
Fig. 4.
Identification and characterization of differentially expressed genes strongly correlated to optical marker values. (a) Pearson coefficients for correlation of optical markers (abnormal nuclei/mm2 and normalized red-to-green ratio) to the expression of the 116 differentially expressed genes between groups with no dysplasia and severe dysplasia. Fifty genes were strongly correlated to the value of abnormal nuclei/mm2 (Pearson coefficient ≤ −0.4 or ≥ 0.4). (b) Nearest centroid classification applied to the principal component analysis of the expression of 50 strongly correlated genes separated sites with no dysplasia and sites with severe dysplasia. (c) Principal component analysis of the expression of 50 strongly correlated genes sites with mild dysplasia. The decision boundary separated sites with mild dysplasia into two groups: 1) a group with gene expression similar to sites with severe dysplasia, and 2) a group with gene expression similar to sites with no dysplasia. (d) Distribution of histologic diagnoses for sites based on decision boundary shown in Fig. 4b. Most sites with mild dysplasia and positive optical markers grouped with the majority of severe dysplasia sites. Most sites with mild dysplasia and negative optical markers grouped with the majority of sites with no dysplasia. (For interpretation of the references to color in this figure legend, the reader is referred to the web version of this article.)

