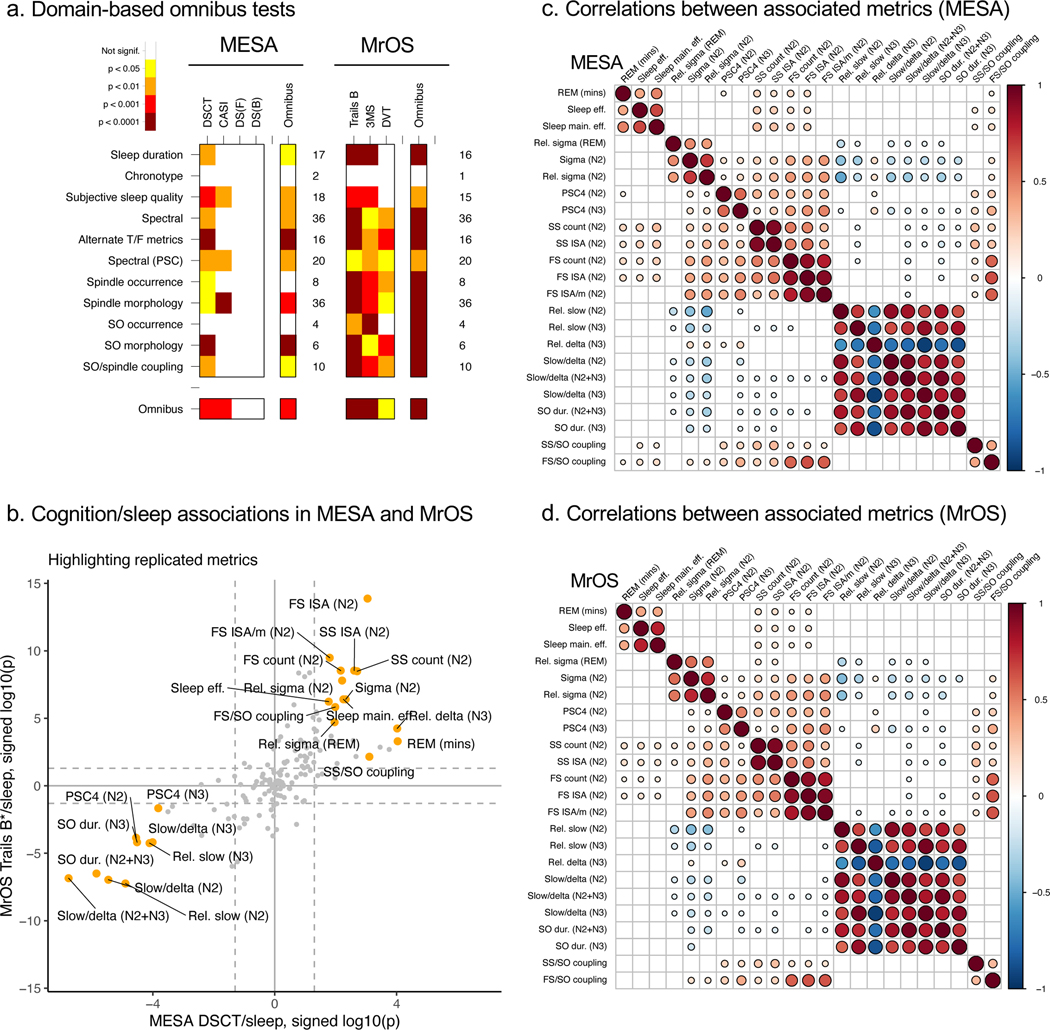
Figure 4. Primary sleep-cognition association results for omnibus tests and the 23 selected objective metrics, in MESA and MrOS.
a) Domain-based omnibus results in MESA and MrOS. Color-coded empirical significance values based on 20,000 permutations, calculated using the baseline covariate model and using the max test statistic to control for multiple testing. See Methods for further details. b) Correspondence of cognition/sleep associations in MESA and MrOS, showing log10-scaled p-values signed by the direction of effect, for DSCT in MESA (x-axis) versus Trails B* in MrOS (y-axis). Labeled orange points indicate the 23 metrics that replicated across cohorts. c) Correlation coefficients (Pearson’s r) in MESA between key sleep metrics, adjusted for baseline covariates, and only showing cells where p < 0.01 and |r| > 0.1. d) As above, for MrOS.

