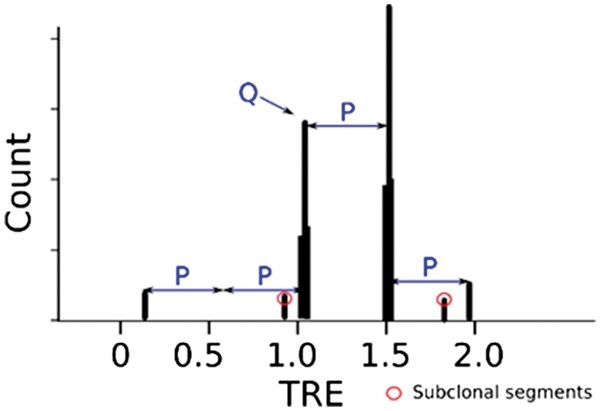
Fig. 2.

The histogram of tumor read enrichment (TRE) from the example in Figure 1. Auto-correlation analysis can identify periodicity P as the interval between neighboring major peaks and Q is the TRE value corresponding to copy-number-two segments. Two minor peaks with circles are subclonal segments. Subclonal segments are excluded during model fitting and selection because our HGM model is designed for clonal segments
