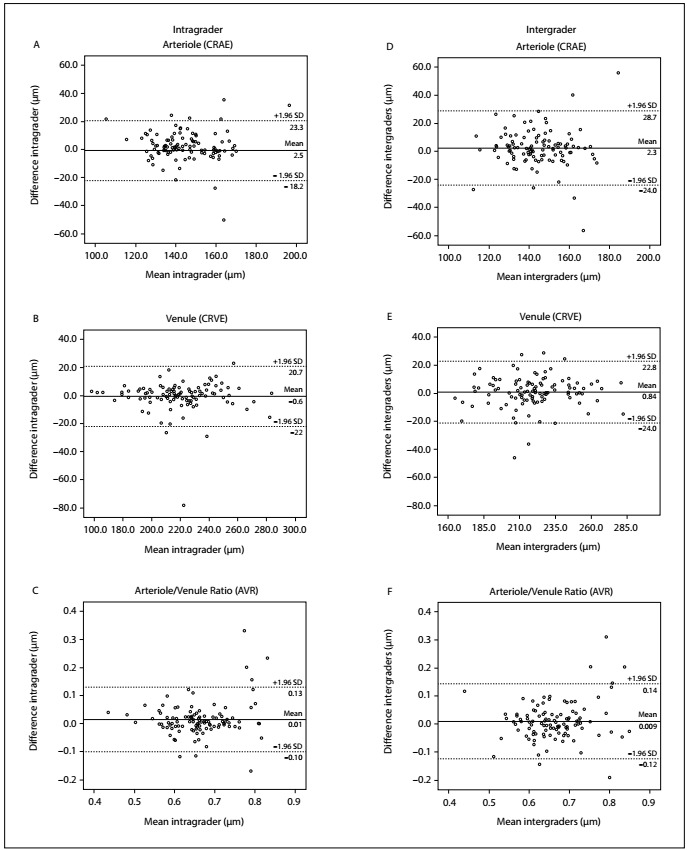
Figure 2: Reproducibility evaluation on Bland-Altman plots of the intra and intergrader differences in retinal microvascular measurements. Dashed lines indicate the 95% confidence interval (CI) of the mean difference, which is indicated by the black line.

