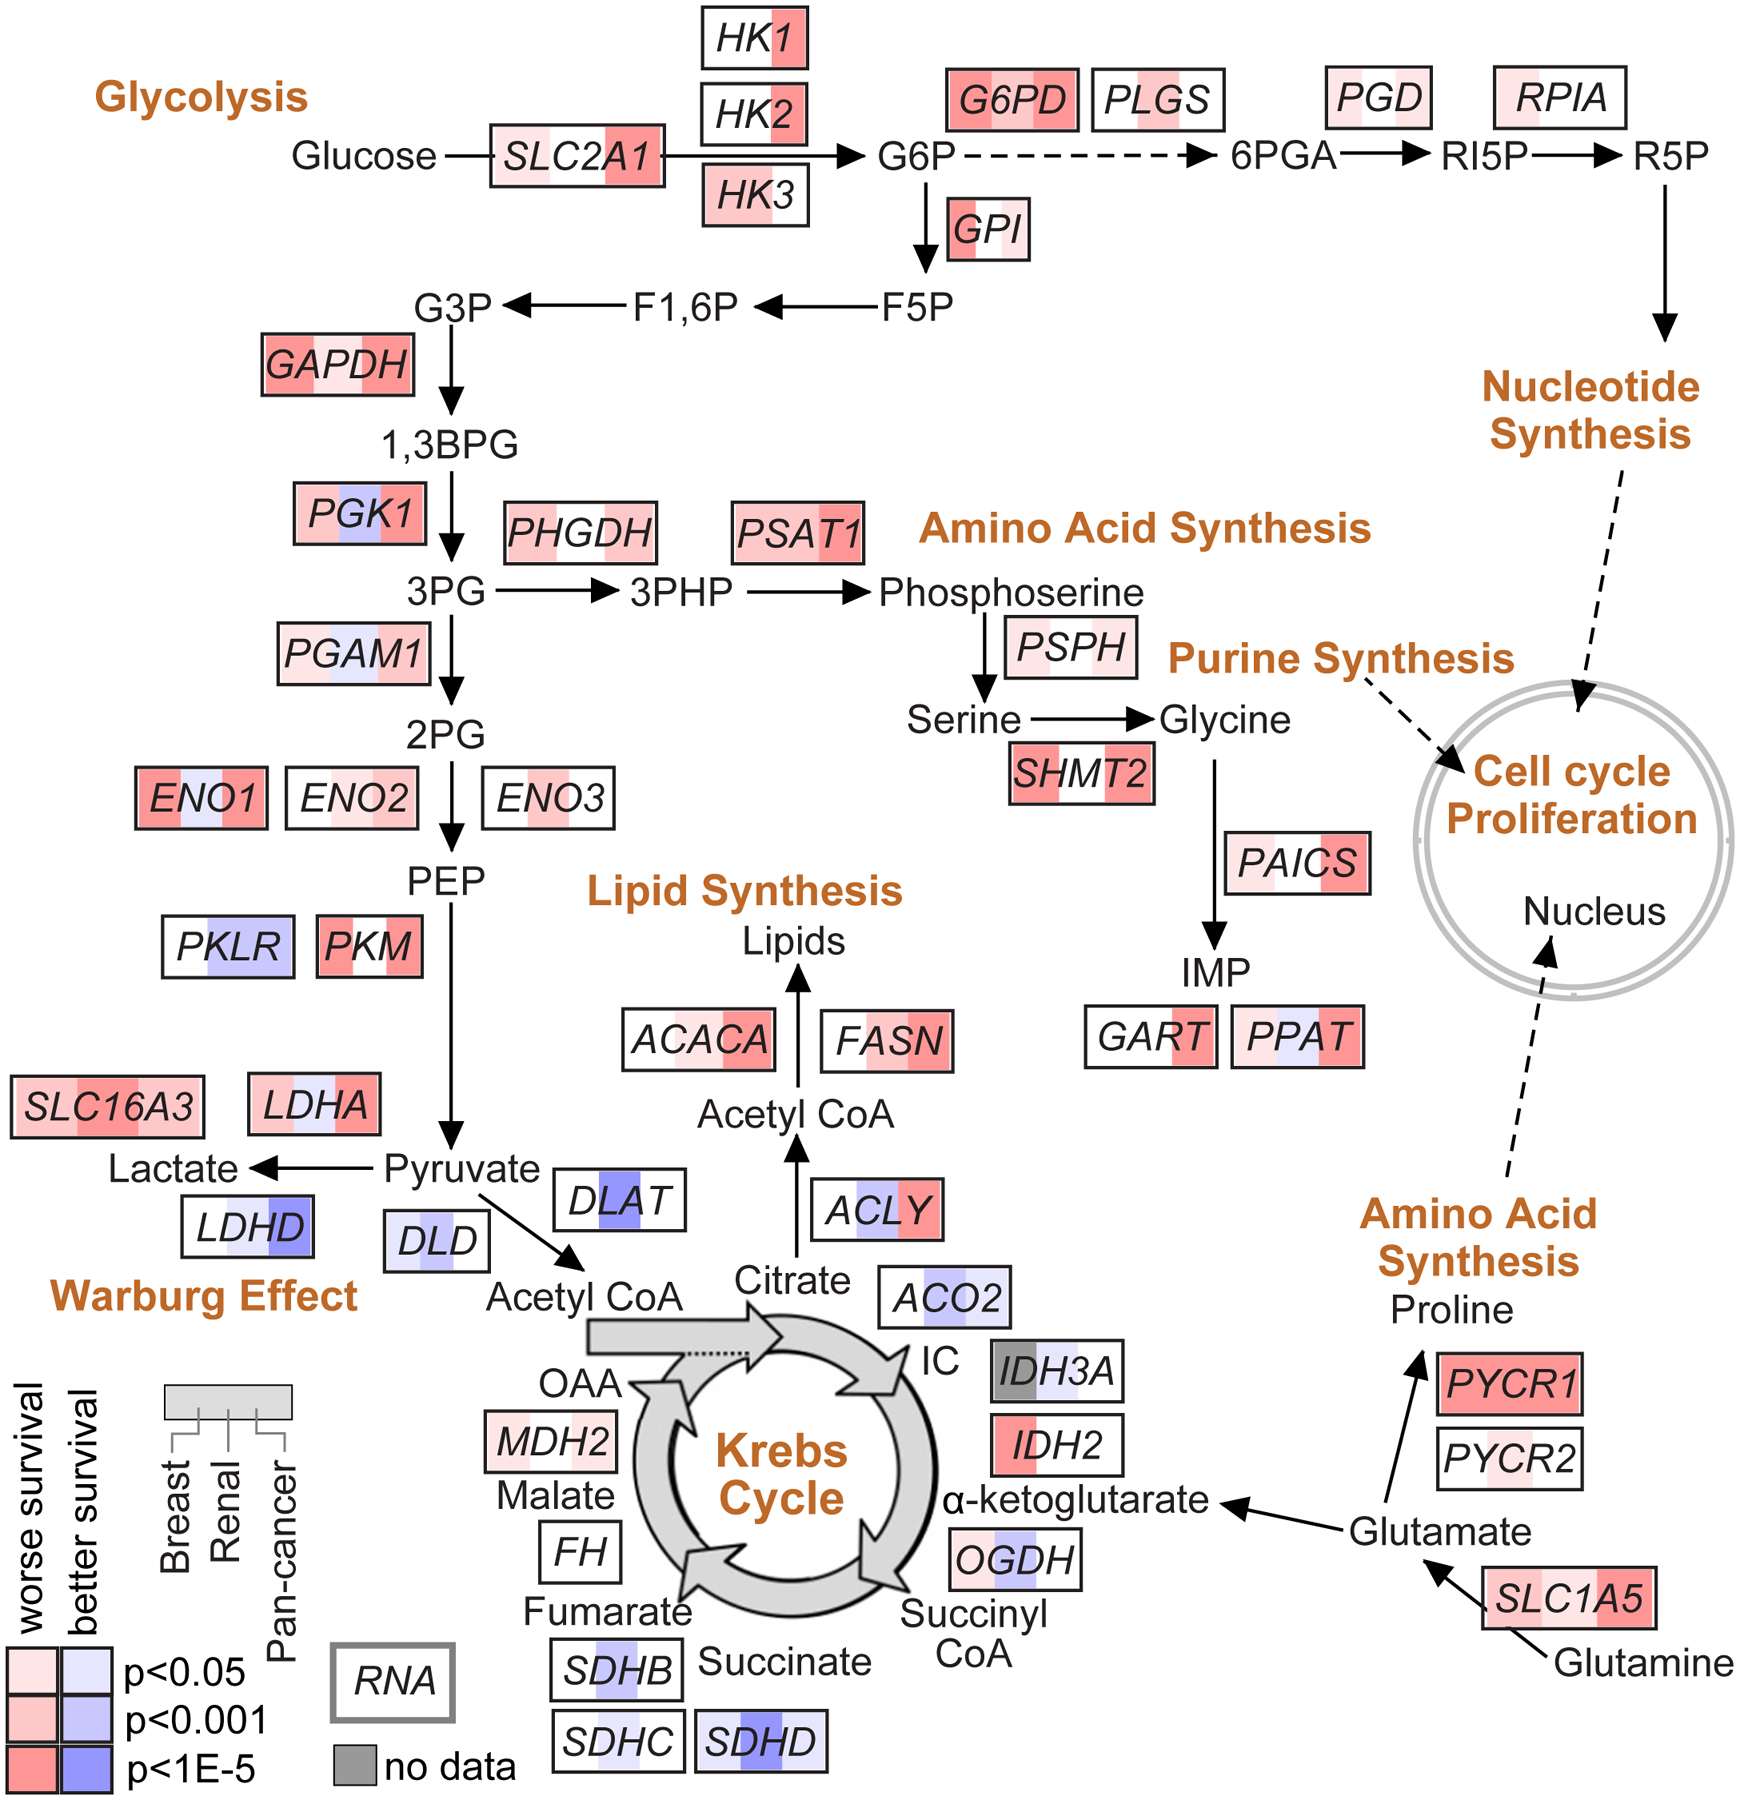
Figure 2. Gene expression correlates of cancer patient survival involving metabolic pathways.

Gene expression correlates of patient survival can be examined for clues as to the molecular biology underlying the more aggressive cancers. Pathway diagram representing core metabolic pathways33,75, with corresponding mRNA correlations with patient survival. Red and blue shading respectively represent the association of increased mRNA expression with worse or better survival, by univariate Cox. For each gene, survival correlations across three cancer expression profiling datasets are represented: breast cancer dataset from Pereira et al.34 (left, n=1904 patients, overall survival endpoint), renal cell carcinoma dataset from TCGA (middle, n=417 patients, overall survival endpoint), pan-cancer dataset from TCGA (right, n=10152 patients, overall survival endpoint, p-values correcting for cancer type).
