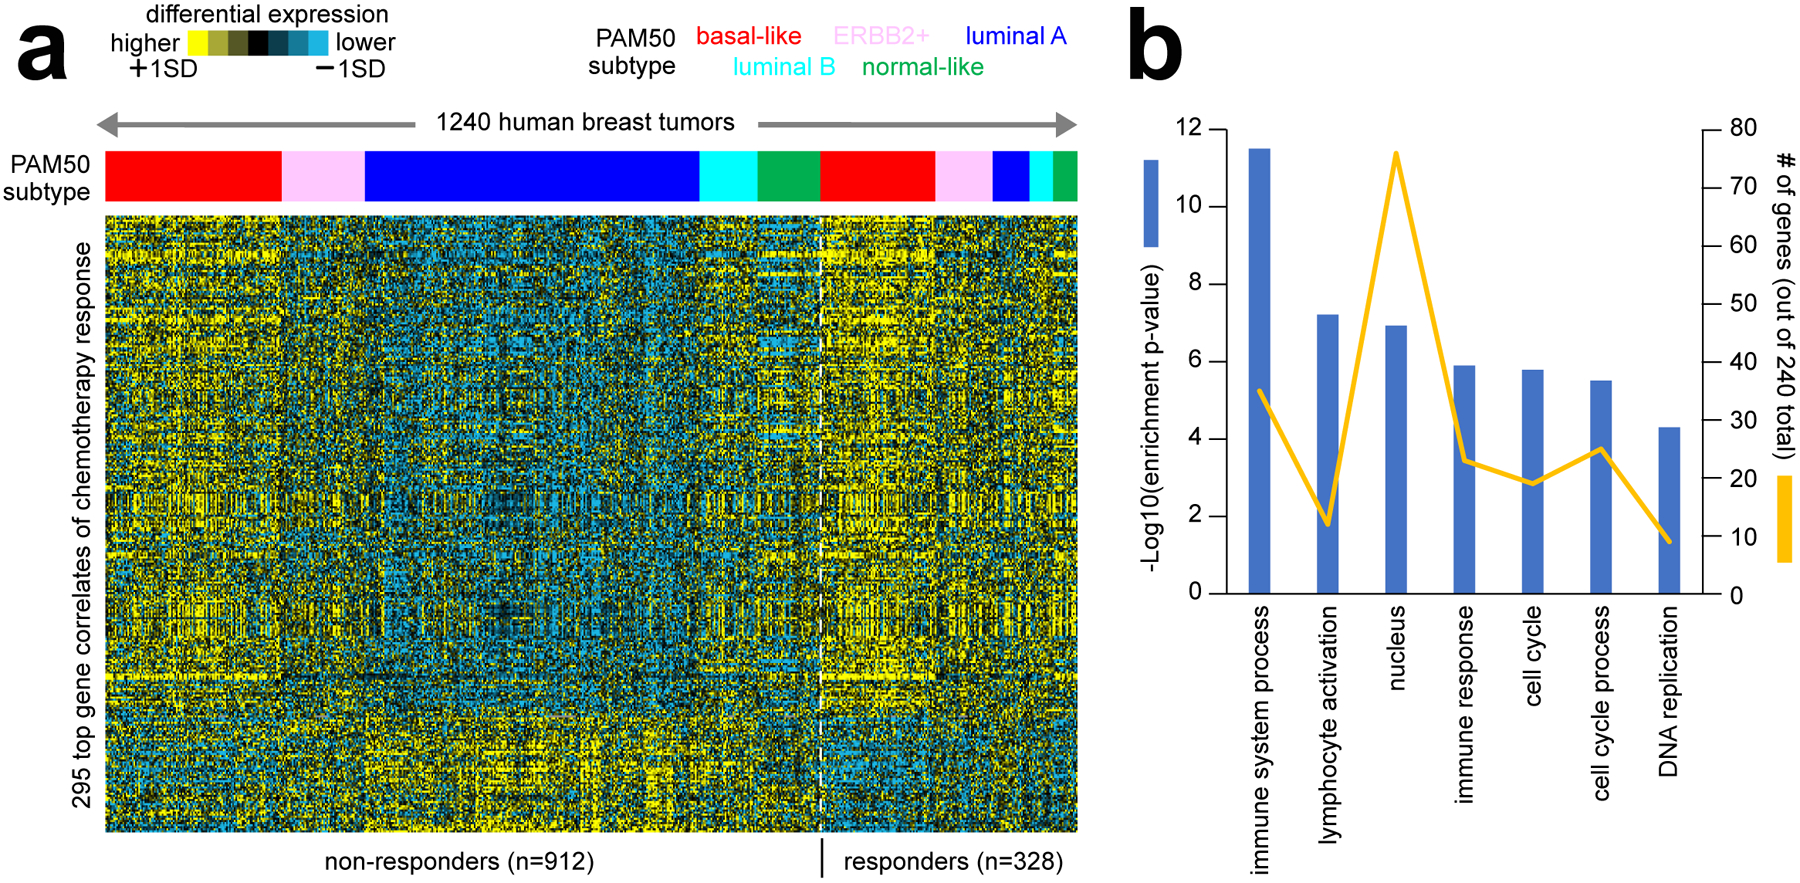
Figure 3. Gene expression correlates of therapeutic response to chemotherapy in breast cancer patients.

(a) Numerous studies have carried out gene expression profiling of pre-treatment breast tumor biopsies from patients treated with neoadjuvant chemotherapy, with patient response recorded at the end of treatment42–48. As part of this review, we assembled a compendium of eight separate datasets from the above studies, representing 1240 tumor expression profiles (GEO accession numbers provided in Data File S1). All datasets were generated using the same Affymetrix gene array platform. In the same manner as carried out in our previous studies5,15,76, we transformed log2 gene expression values to standard deviations from the median within each dataset, removing batch effect differences among datasets. We assessed the correlation of expression with pathologic chemotherapy response (path CR) for each gene feature after correcting for Pam50 subtype76 by linear modeling. The heat map shows expression patterns for a top set of 295 gene features (p<0.001, out of 22269 total). (b) Selected significantly enriched GO terms77 within the genes higher in breast tumors from patients with path CR (from part a). Enrichment p-values and numbers of genes in the path CR-associated gene set are indicated for each GO term. Enrichment p-values by one-sided Fisher’s exact test.
