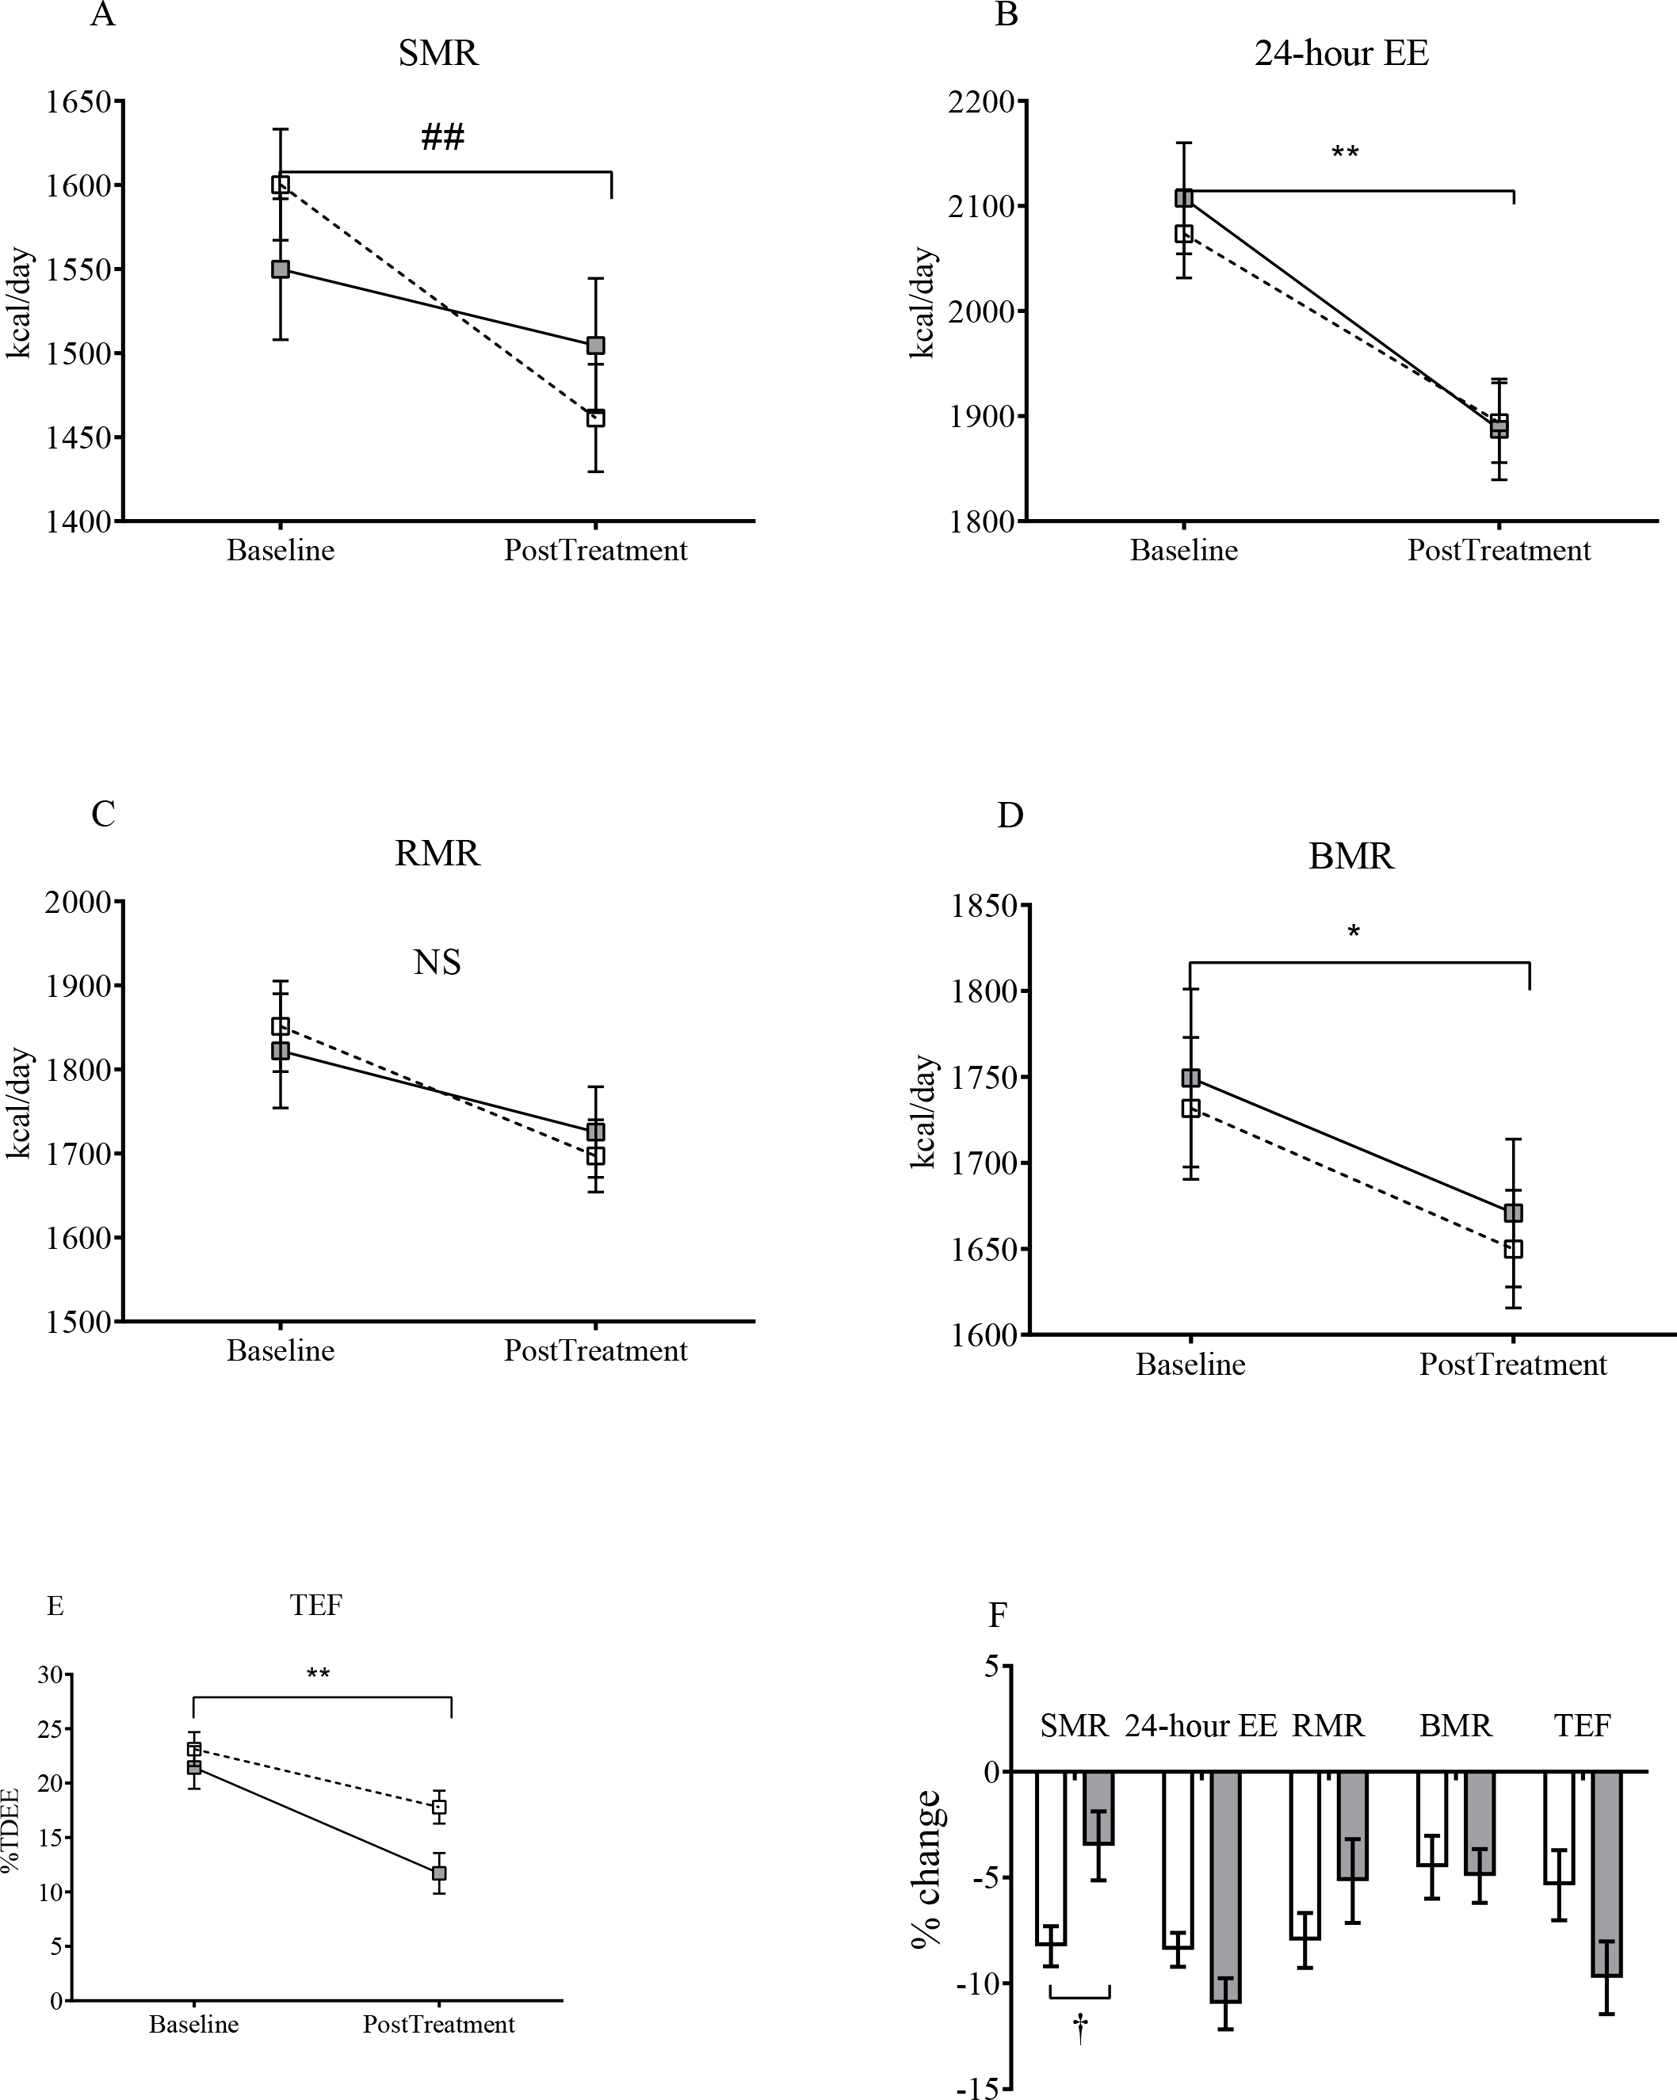
Figure 2: Baseline and Post-Intervention Values and Relative Changes in Energy Expenditure Components Adjusted for Body Composition.

(A-E) Sleeping metabolic rate (SMR), 24-hour energy expenditure (24-hour EE), resting metabolic rate (RMR), basal metabolic rate (BMR) and thermic effect of feeding (TEF), respectively, at baseline and post-treatment. The reduction in SMR was lower in the SAR425899 group. (F) Percent changes in the same components. There was smaller percent change in SEE in the SAR425899 group. Grey and white squares and bars represent means and standard error of mean for the SAR425899 and placebo groups, respectively. Comparisons of least square means absolute change done by repeated measures multivariate analysis of variance and percent change by independent sample t-tests. ##, p<0.01 for time × group effect. **, p<0.01 for time effect in both groups. †, p<0.05 for group effect. Placebo, open box/bar; SAR425899, grey box/bar.
