
Figure 2. Clustering identifies eleven varieties of neutrophil, two of which are trauma-specific.
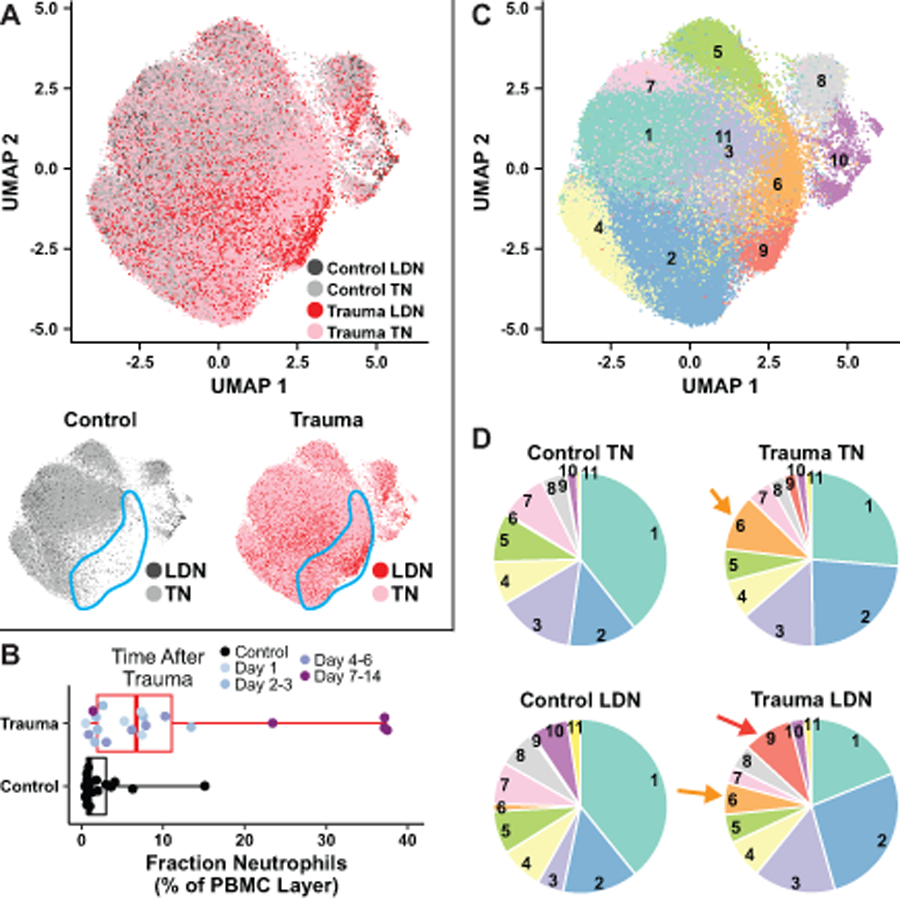
A. Above, CD15+, CD66b+ cells (neutrophils) from the entire collection of trauma patients and controls analyzed by Seurat and displayed in two dimensions with UMAP, with similar cells near each other, colored by sample type. Below, control neutrophils (left) and trauma neutrophils (right) in the same projection as in A are colored by their presence in total leukocytes (TN) or their co-sedimentation in the PBMC layer (LDN). The blue outlined area indicates a region of UMAP space occupied by trauma neutrophils but severely depleted of control neutrophils. B. Box-and-whisker plot showing percentage of cells sedimenting in the PBMC layer that were CD15+/CD66b+ in the control and trauma samples. Boxes cover the interquartile range (25–75th percentile) with a line marking the median, and whiskers extend through the full range of the data. C. UMAP projection from A, colored for each Seurat-defined neutrophil cluster. D. Pie charts indicate the total proportion of neutrophils of each sample type that belong to each of the 11 clusters. Orange arrows indicate cluster 6, present only in trauma neutrophils, and red arrow indicates cluster 9, present only in low-density trauma neutrophils.