
Figure 1.
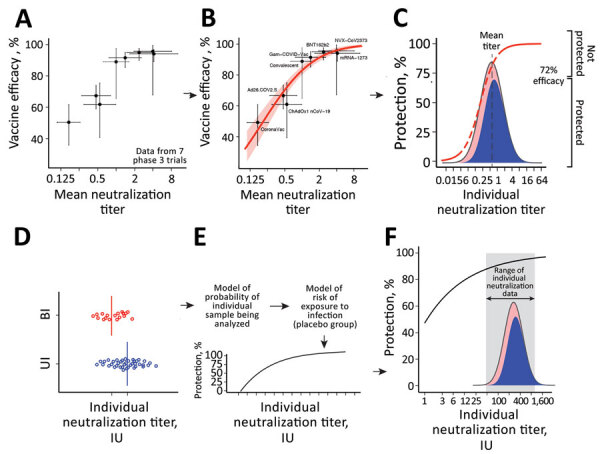
Predicting protection from symptomatic SARS-CoV-2 infection by using approaches to elucidate the relationship between neutralizing antibody titers and protection from COVID-19 (the protection curve): the vaccine-comparison (A–C) and breakthrough-infection (D–F) approaches. The 2 approaches are illustrated schematically: data used (A, D); model fit to data (B, E); and estimated protection (C, F) The vaccine-comparison approach used data on mean neutralization titer from phase 1/2 vaccine trials (normalized to convalescing persons in the same study; x-axis) and observed vaccine efficacy against symptomatic SARS-CoV-2 infection in phase 3 trials (y-axis; n = 7 vaccine trials plus 1 study of infection risk in convalescing persons) (A, B). Using the observed distribution in neutralization titers for a given vaccine and the protection curve, we sum over the whole population to predict the proportion of susceptible (red) or protected (blue) persons for a given vaccine and to estimate protective efficacy for different neutralizing antibody levels (C). Fitting across all vaccines and convalescent persons simultaneously derives the protection curve that best fits the neutralization and protection data (B). The breakthrough-infection model uses neutralization titers of persons with symptomatic breakthrough infections (n = 36 for mRNA-1273 [Moderna, https://www.modernatx.com] and n = 47 for ChAdOx1 [AstraZeneca, https://www.astrazeneca.com]) and uninfected persons (n = 1,005 for mRNA-1273 and n = 828 for ChAdOx1) (3,4). This method’s underlying risk model adjusts for demographic risk factors and for the probability of being sampled in the study to remove these potential sources of bias (E). The protection curve reflects an estimate of the vaccine efficacy in subgroups of persons with specific neutralization titers after the 2-phase sampling design was adjusted for (F). Data and model relationship in panels A and B are from (2).