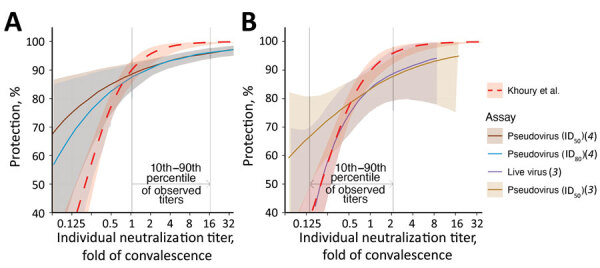
Figure 2.

Comparisons of the estimated curves for protection from SARS-CoV-2 infection from 2 vaccines: A) mRNA-1273 (Moderna, https://www.modernatx.com) (4); B) ChAdOx1 (AstraZeneca, https://www.astrazeneca.com) (3). The relationships between vaccine efficacy against COVID-19 infection (y-axis) and neutralization titers (protection curve) that were estimated in each study (2–4) are shown. The protection curve derived from the vaccine-comparison model (red dashed line) is compared with the modeled protection curves estimated from breakthrough-infection studies by Gilbert et al. (4) (dark brown for the results from the ID50 and teal lines for the results from the ID80 neutralization titer in in vitro pseudovirus neutralization assays) (A) and Feng et al. (3) (purple for the results from in vitro native (live) SARS-CoV-2 virus and light brown for the pseudovirus neutralization assays) (B). Shaded areas indicate 95% CIs from each model. These curves were extracted from the cited studies (Appendix, https://wwwnc.cdc.gov/EID/article/29/2/22-1422-App1.pdf), and differences between assays were controlled for by normalizing the curve from each study by the mean neutralization titer of the uninfected vaccinees in each study. The normalized curves were then represented on a fold-of-convalescent scale by multiplying by the mean neutralization titer of vaccinees compared with convalescing persons as reported in the phase 1/2 trials (9,10). The vaccine-comparison model agrees closely with the breakthrough-infection models in the neutralization titer ranges where data were most abundant (vertical gray lines indicate 10th to 90th percentiles of the data available in each study). ID50, 50% infectious dose; ID80, 80% infectious dose.
