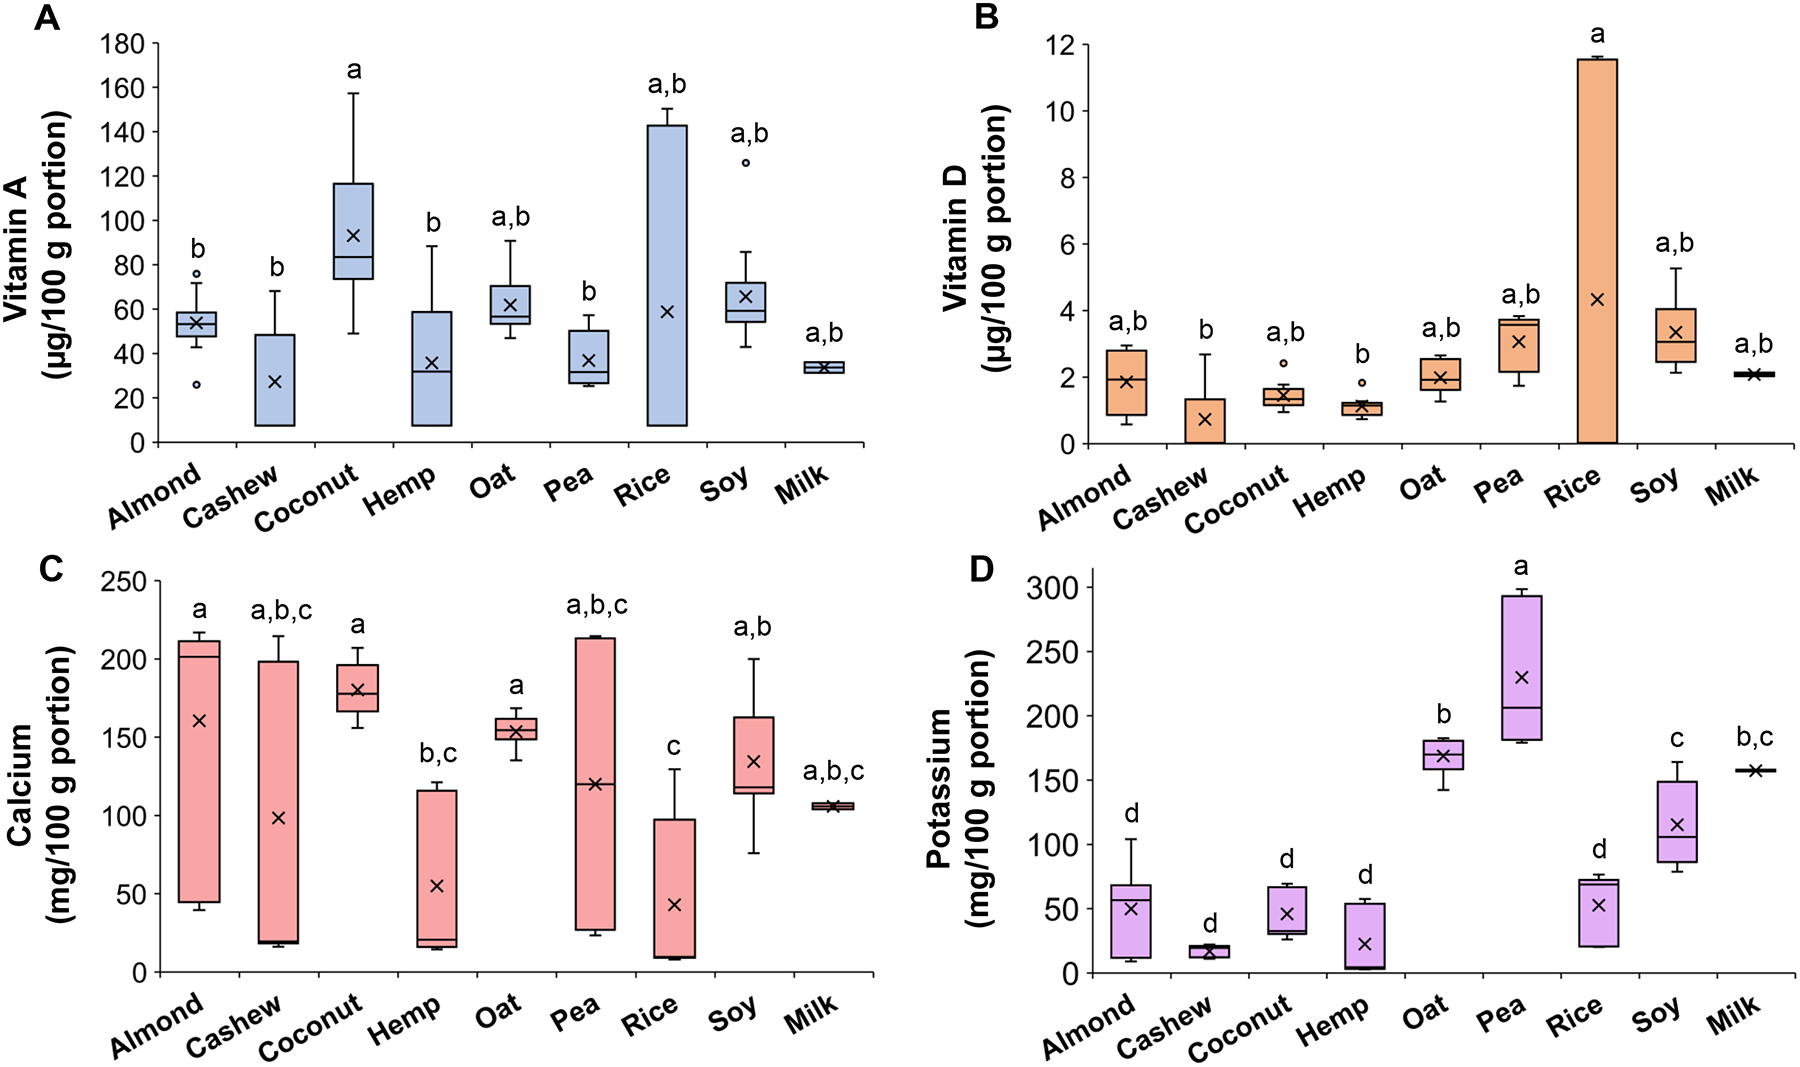
Figure 1. Box plot of the concentrations of target micronutrients in a market basket analysis of eight different types of PBMAs and milk.

(A) vitamin A (expressed as RAE), (B) vitamin D, (C) calcium and (D) potassium. Information on the number of samples per PBMA type are found in Tables 1–4. Vitamin A in samples was detected as retinyl palmitate. Samples with quantifiable amounts of vitamin D contained only vitamin D2 except for O2, P2, and milk, which contained only vitamin D3. Values not sharing the same letter within PBMA type are significantly different (P<0.05) as determined by Tukey’s HSD post hoc test.
