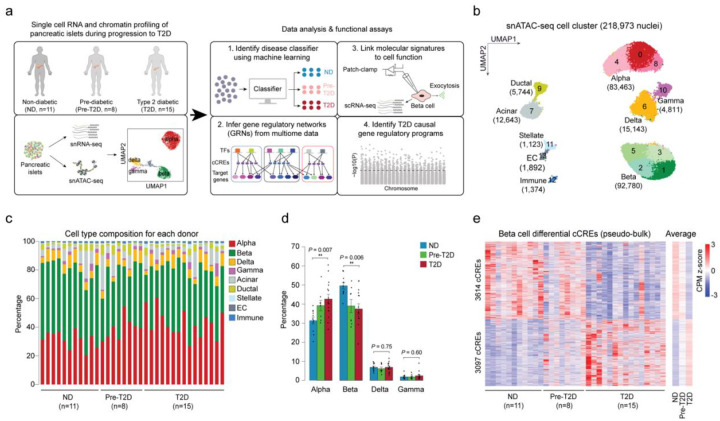
Figure 1. Beta cells exhibit changes in chromatin activity in type 2 diabetes.
(a) Schematic outlining study design. snATAC-seq was performed on nuclei from pancreatic islets from 11 non-diabetic (ND), 8 pre-diabetic (pre-T2D) and 15 type 2 diabetic (T2D) human donors. Single nucleus multiome (ATAC+RNA) analysis was performed on a subset of donors (6 ND, 8 pre-T2D, 6 T2D). We used machine learning to identify classifiers for beta cells in ND, pre-T2D and T2D, inferred gene regulatory networks (GRNs), linked molecular signatures to beta cell function using Patch-seq, and identified T2D causal gene regulatory programs. (b) Clustering of chromatin accessibility profiles from 218,973 nuclei from non-diabetic, pre-diabetic, and T2D donor islets. Cells are plotted using the first two UMAP components. Clusters are assigned cell type identities based on promoter accessibility of known marker genes. The number of cells for each cell type cluster is shown in parentheses. EC, endothelial cells. (c) Relative abundance of each cell type based on UMAP annotation in Figure 1b. Each column represents cells from one donor. (d) Relative abundance of each islet endocrine cell type in ND, pre-T2D and T2D donor islets. Data are shown as mean ± S.E.M. (n = 11 ND, n = 8 pre-T2D, n = 15 T2D donors), dots denote data points from individual donors. ***P < .001, **P < .01, *P < .05; ANOVA test with age, sex, BMI, and islet index as covariates. (e) Heatmap showing chromatin accessibility at cCREs with differential accessibility in beta cells from ND and T2D donors. Columns represent beta cells from each donor (ND, n=11; pre-diabetic, pre-T2D, n=8; T2D, n=15) and all ND, pre-T2D and T2D donors with accessibility of peaks normalized by CPM (counts per million).

